
Products · Urban and spatial decision support
Urban Mobility Digital Twin
A living model of a city's traffic: simulate the change before you build it.
Web platform with live data fusion, simulation engine, impact model and decision workflow
Overview
If we change this road, line, development or policy, what happens to traffic, emissions and cost across the city?
A web-based digital twin of urban mobility for any city. It builds the road, junction, public-transport and parking network from open map data and municipal GIS, fuses live and historical traffic from cameras, navigation-app data, roadside counters and IoT vehicle sensors, lets planners edit the network or test policies, runs microscopic traffic simulation, and reports the results as two auditable layers: traffic performance, and derived impacts such as emissions, fuel and cost with the calculation method attached to every figure.
- City-wide, any region
- Scope
- Cameras, navigation apps, counters, IoT
- Live inputs
- Microscopic traffic simulation
- Engine
- 2 auditable layers
- Results
System architecture
Schematic of the main components, from inputs to delivered outputs.
Inputs
- Open map and municipal GIS data
- Traffic cameras
- Navigation-app traffic data
- Roadside counters and IoT sensors
- Transit schedules and parking data
Twin
- Road, junction and signal network
- Rail, metro and bus lines
- Parking and land use
- Travel demand model
Simulation and policy
- Scenario editor
- Microscopic simulation
- Mode choice and policy levers
- Two-layer impact model
Decision
- Live map and comparison
- Decision briefs and KPIs
- Role-based approval workflow
- Exports and API
Example outputs
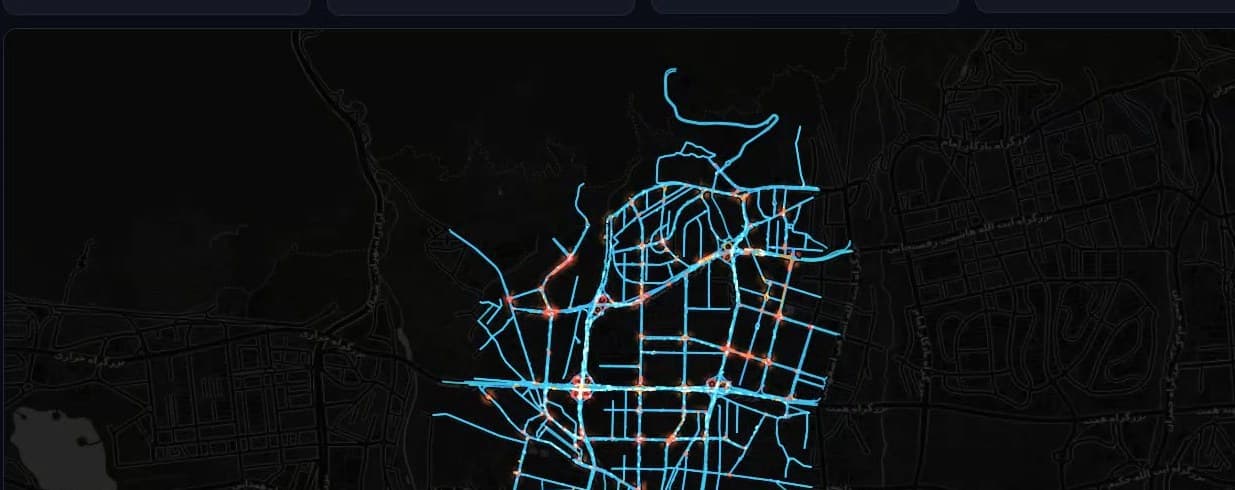
Live map view: simulated speed on every link of a modelled road network. Basemap © OpenStreetMap contributors © CARTO.
How it works
Pipeline and maturity of each stage
- 01
Network model
OperationalThe road network with junctions and signal control, public-transport lines for rail, metro and bus, parking facilities and land use are built from open map data and municipal GIS for any administrative area.
- 02
Live and historical data fusion
OperationalTraffic cameras, navigation-app speed and travel-time data, roadside counters and IoT vehicle sensors, transit schedules and origin–destination surveys are ingested into one model. Every figure is labelled as measured, calibrated or estimated.
- 03
Travel demand
OperationalAutomatic traffic analysis zones; demand from gravity models, uploaded origin–destination matrices, or a graph neural network that recovers demand from observed traffic.
- 04
Scenario editor
OperationalEdit roads and junctions, lines and headways, developments, parking supply and price, and policy levers such as congestion charging, access restrictions, transit frequency and fuel pricing. Every change is a reversible, reproducible scenario.
- 05
Microscopic simulation
OperationalStaged simulation pipeline with fixed seeds, replications, confidence intervals, background jobs and gridlock detection, so results are statistically comparable between scenarios.
- 06
Two-layer impact model
OperationalLayer one reports speed, queue length, waiting time, travel time, throughput and density per link. Layer two derives fuel, CO₂, NOx, particulate and CO emissions and cost with speed-dependent, fleet-weighted factors, annualised with the method attached.
- 07
Transit, parking and land use
OperationalLine capacity and crowding, logit mode choice with capacity feedback, parking cruising and pricing, land-use developments, a recommendation engine and parametric infrastructure costing with utility-conflict alarms.
- 08
Decision workflow and outputs
OperationalLive map with particle flow, 3D congestion columns and a 24-hour timeline; before/after comparison; per-zone reports and executive decision briefs; role-based approval; exports to PDF, CSV, GeoJSON and Shapefile; an assistant grounded in scenario results; cloud or on-premises.
Data used
- Open map data and municipal GIS
- Traffic cameras
- Navigation-app traffic data
- Roadside counters and IoT vehicle sensors
- Transit schedules (GTFS)
- Origin–destination surveys
- Parking and land-use data
Methods and models
- Microscopic traffic simulation with replications
- Graph neural network demand estimation
- Volume–delay functions
- Gravity demand models
- Logit mode choice
- Speed-dependent emission factors
- Benefit–cost portfolio optimisation
Outputs
- Link-level traffic performance and congestion maps
- Fuel, emission and cost impacts with provenance
- Before/after scenario comparison
- Executive decision briefs and per-zone reports
- PDF, CSV, GeoJSON and Shapefile exports; REST API
Who it is for
- Municipal transport and planning departments
- Infrastructure investment appraisal
- Public-transport and parking planning
- Environmental and emissions policy
More in Urban and spatial decision support
All urban and spatial decision support products
From space. For Earth.
Start with ARASAT
Tell us what you need to monitor, understand or protect. Our team works with you from the first conversation to a running program.