ARASAT

Product catalogue

Answers from orbit, organised by the question

34 products in 8 families. Each family answers one class of question; each product is described by what it measures, how it is delivered today and what it returns.

How products are delivered

Three ways to take a product, one account

The tag on every product says how it is delivered today. Buying one product never affects another, and an organisation can hold different arrangements for different products under one administration.

  • Hub platform

    Hub platforms

    Self-service in the ARASAT Hub on a subscription: log in, define an area and run the analysis yourself. Water monitoring and forecasting are delivered this way today.

  • Processing service

    Processing services

    Analyses the team runs per area of interest and delivers as maps, statistics and reports: crop, field boundary, irrigation, land cover, change and super-resolution. Priced by area and compute.

  • Engagement

    Engagements

    Specified and built per client: oil spill monitoring for a maritime area, mineral exploration, subsidence, digital twins and WebGIS platforms, with training and handover.

  • In development

    In development

    Capabilities in active development, available as pilots on a defined area and period so accuracy is assessed on your own ground.

Catalogue

Product families

Ordered by relevance to international buyers. Products with an arrow have a detailed page.

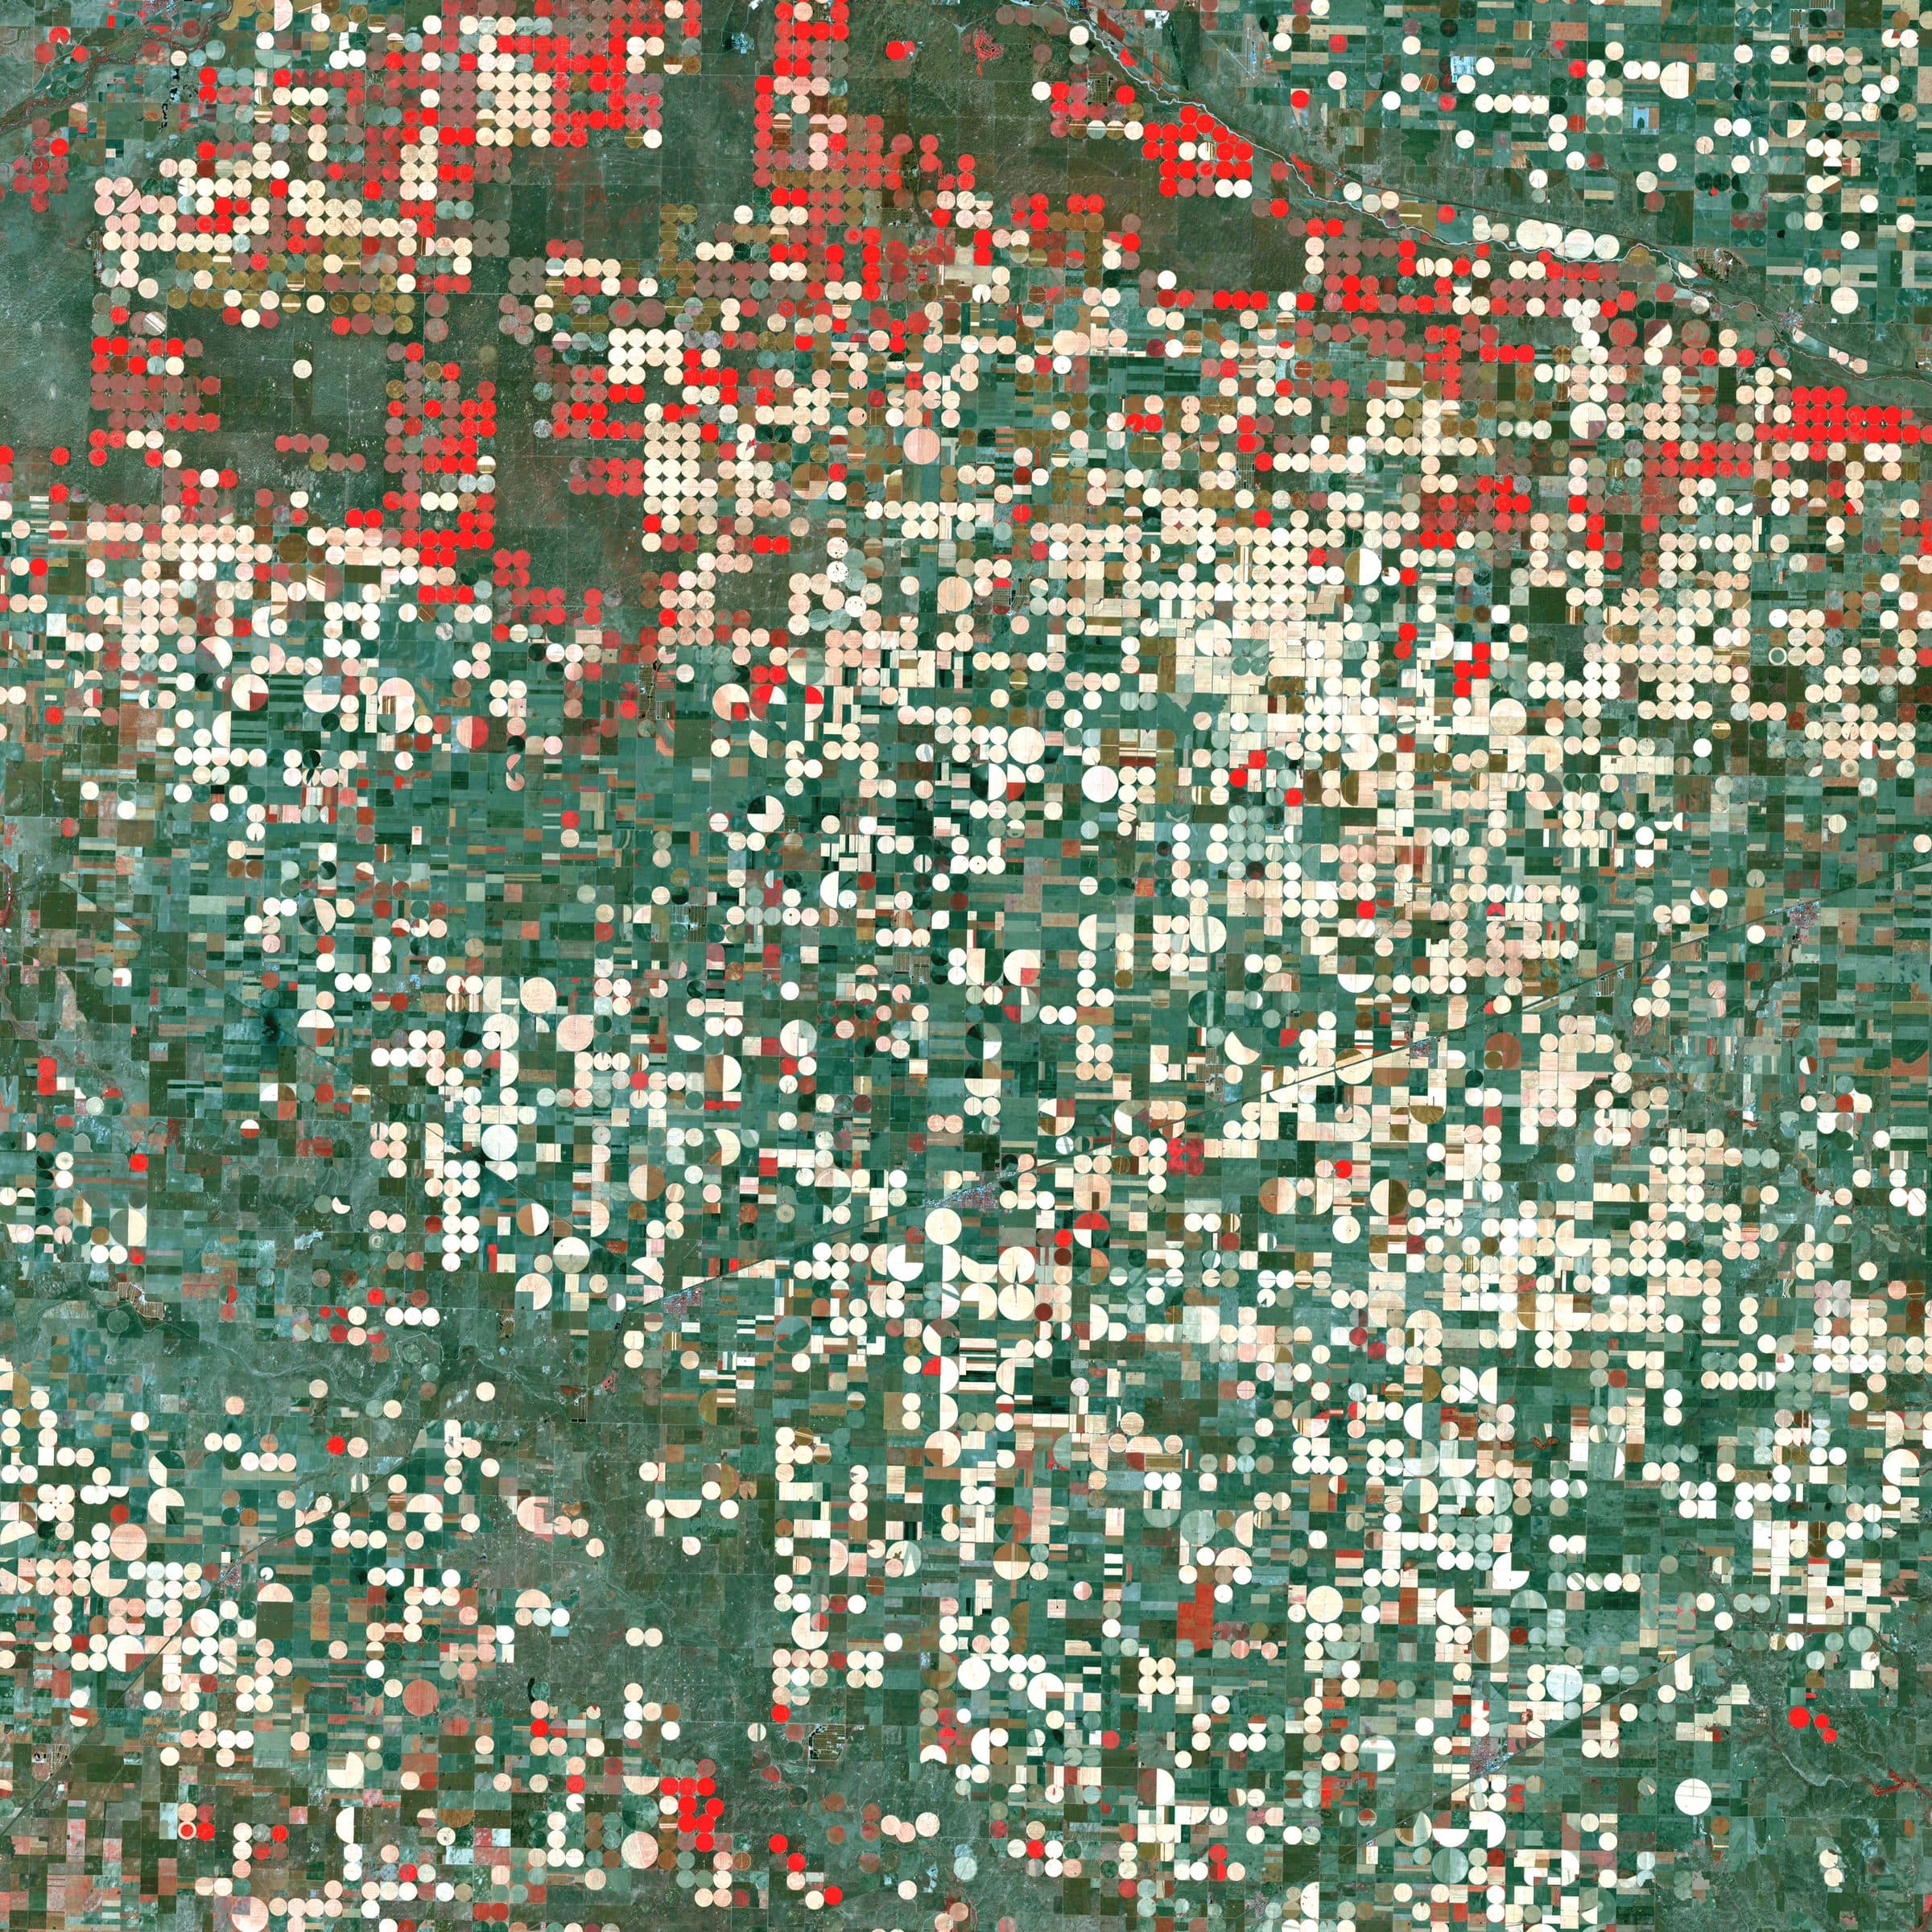
Satellite view of irrigated agricultural fields

01 · Field-level agricultural intelligence

Agriculture

Crop type, field boundaries, irrigation method and cultivated area derived from satellite time series rather than declaration, following the crop calendar of the zone the analysis is run in.

  • Crop type classification

    Field-level crop identification from the seasonal phenological signature, produced in-season.

    Processing service
  • Field boundary extraction

    Automatic delineation of agricultural parcels, independent of cadastral records.

    Processing service
  • Rainfed / irrigated classification

    Separation of irrigated from rainfed cropland from fused radar and optical time series.

    Processing service
  • Cultivated-area mapping

    Planted area by crop, aggregated from field to district and national scale on one consistent method.

    Processing service
  • Crop condition and stress

    Red-edge indices flag canopy stress weeks before standard vegetation indices.

    Processing service
  • Irrigation water demand

    Satellite evapotranspiration converted to crop water requirement per field and per scheme.

    In development
  • Agricultural water accounting

    Integrated solution: parcel map, water volume, cost and value per parcel per season.
    In development
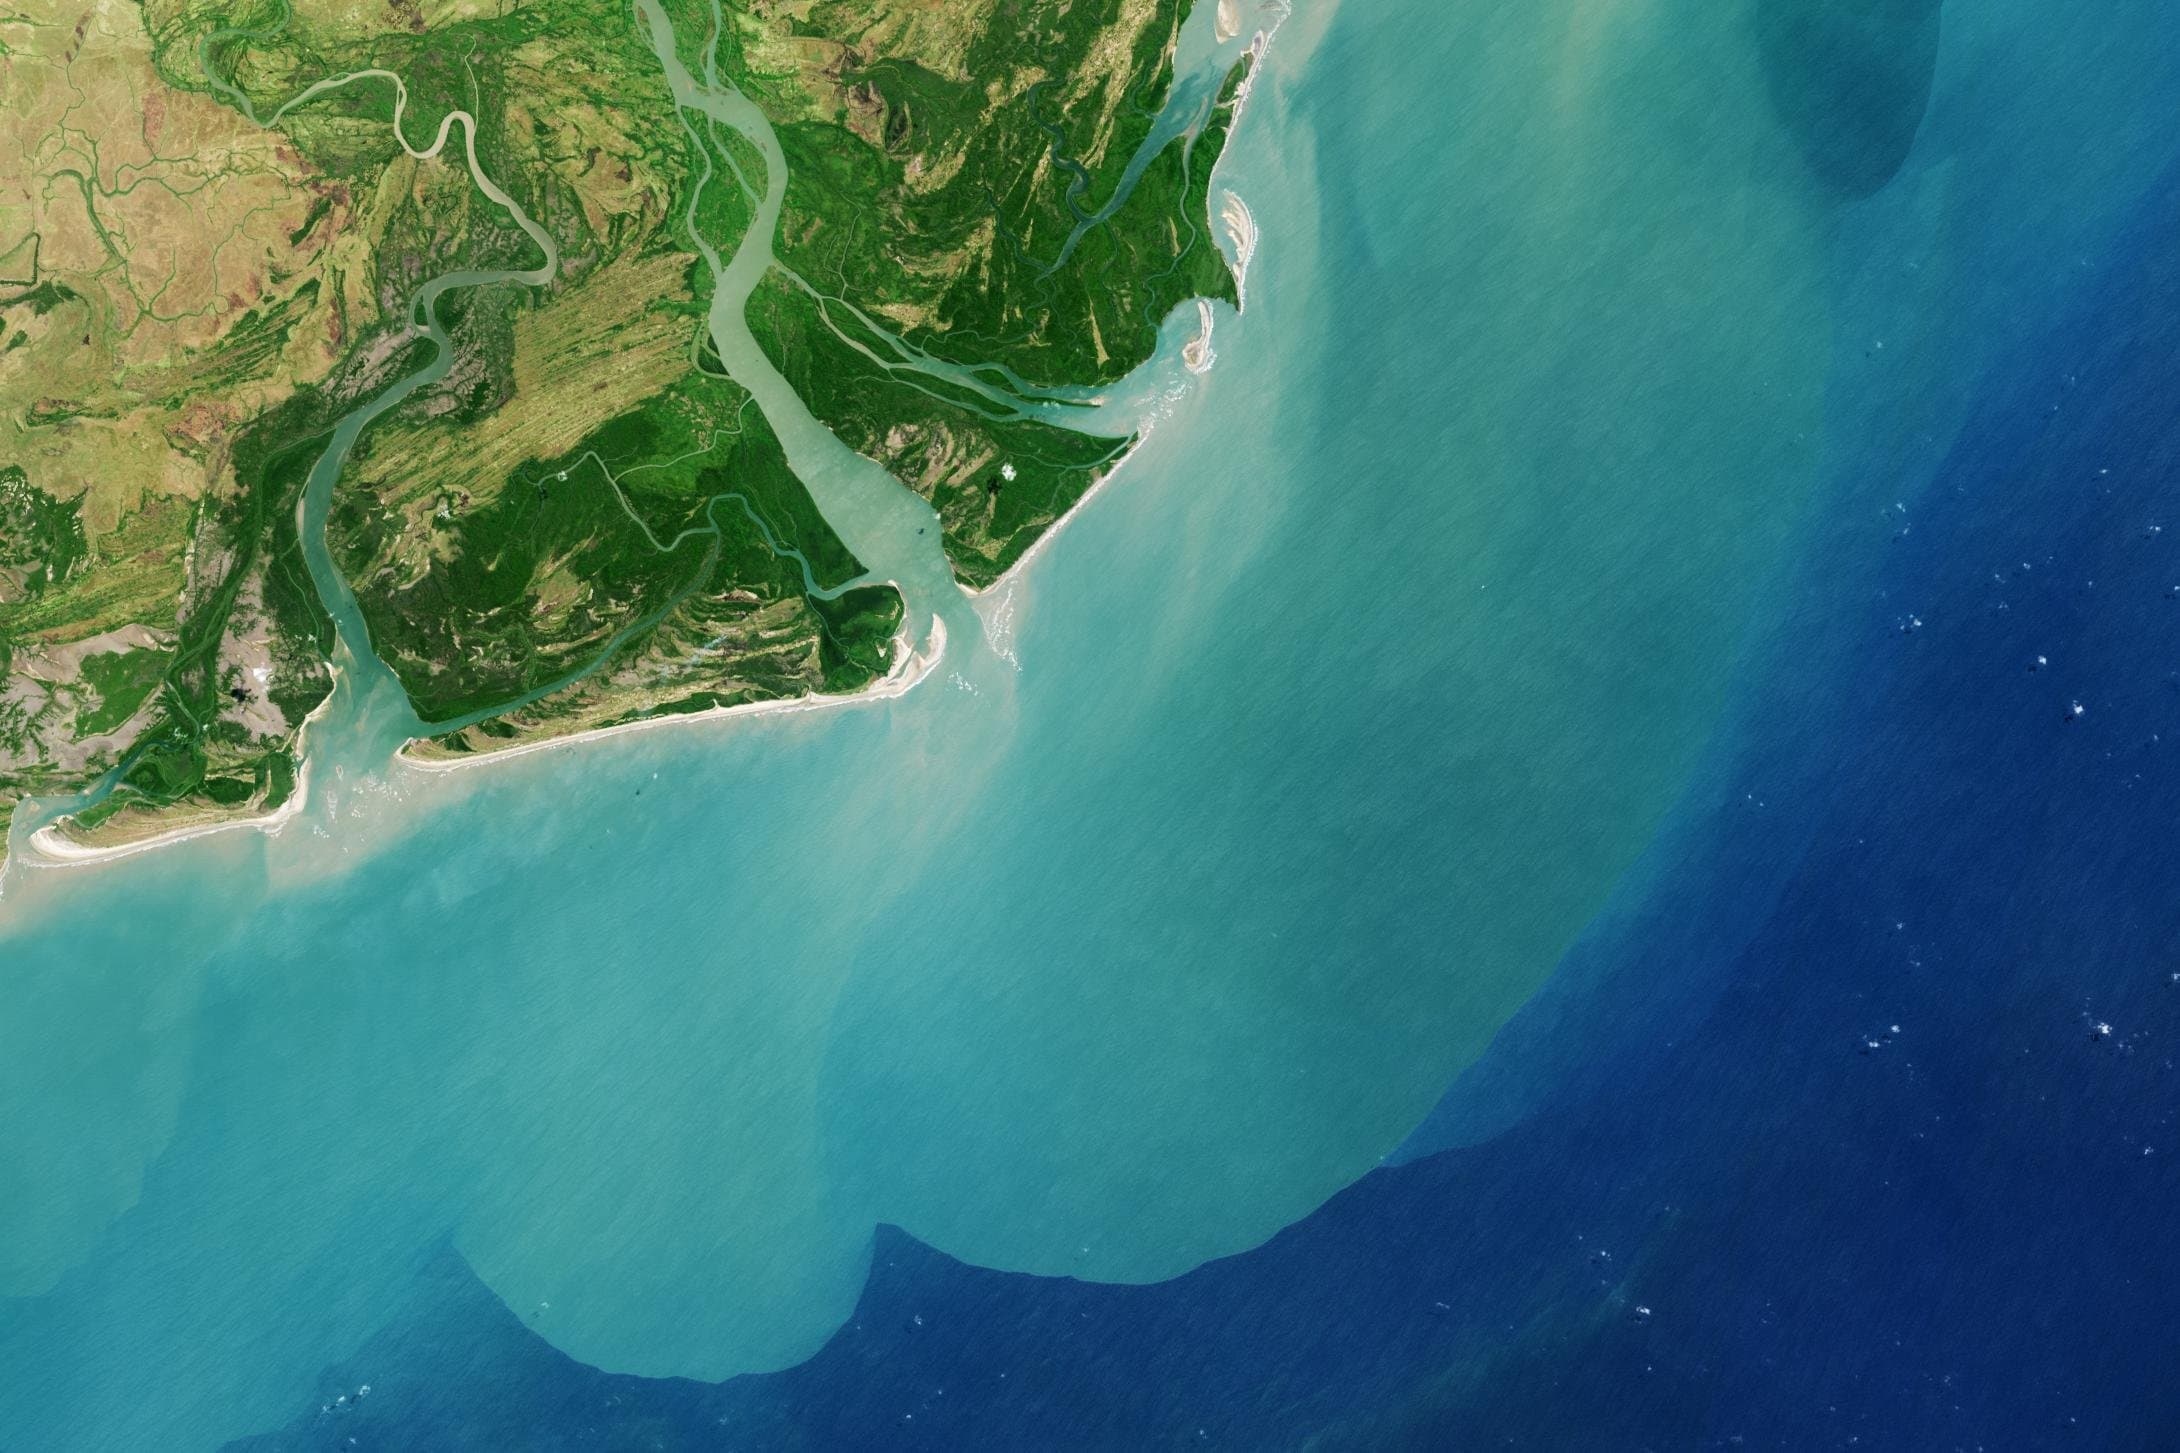
Satellite view of a river delta and surrounding land

02 · What is on the ground and what changed

Land and change

Land cover, land use and every kind of change that matters on it, classified consistently across four decades of archive so change is measured rather than estimated.

  • Land use and land cover

    Automated classification into built-up, agriculture, forest, rangeland, water and barren land, extendable to a client's own classes.

    Processing service
  • Multi-temporal change detection

    What changed between dates, down to individual structures on super-resolved imagery.

    Processing service
  • Forest and rangeland vitality

    Canopy health, degradation and long-term vegetation trend.

    Engagement
  • Fire detection and burned area

    Active fire from thermal sensors, burned-area delineation and post-fire recovery.

    Engagement
  • Land subsidence (InSAR)

    Millimetre-scale ground deformation from radar interferometry.

    Engagement
  • Coastal dynamics

    Shoreline advance and retreat, delta migration and erosion hotspots over the archive.

    Engagement
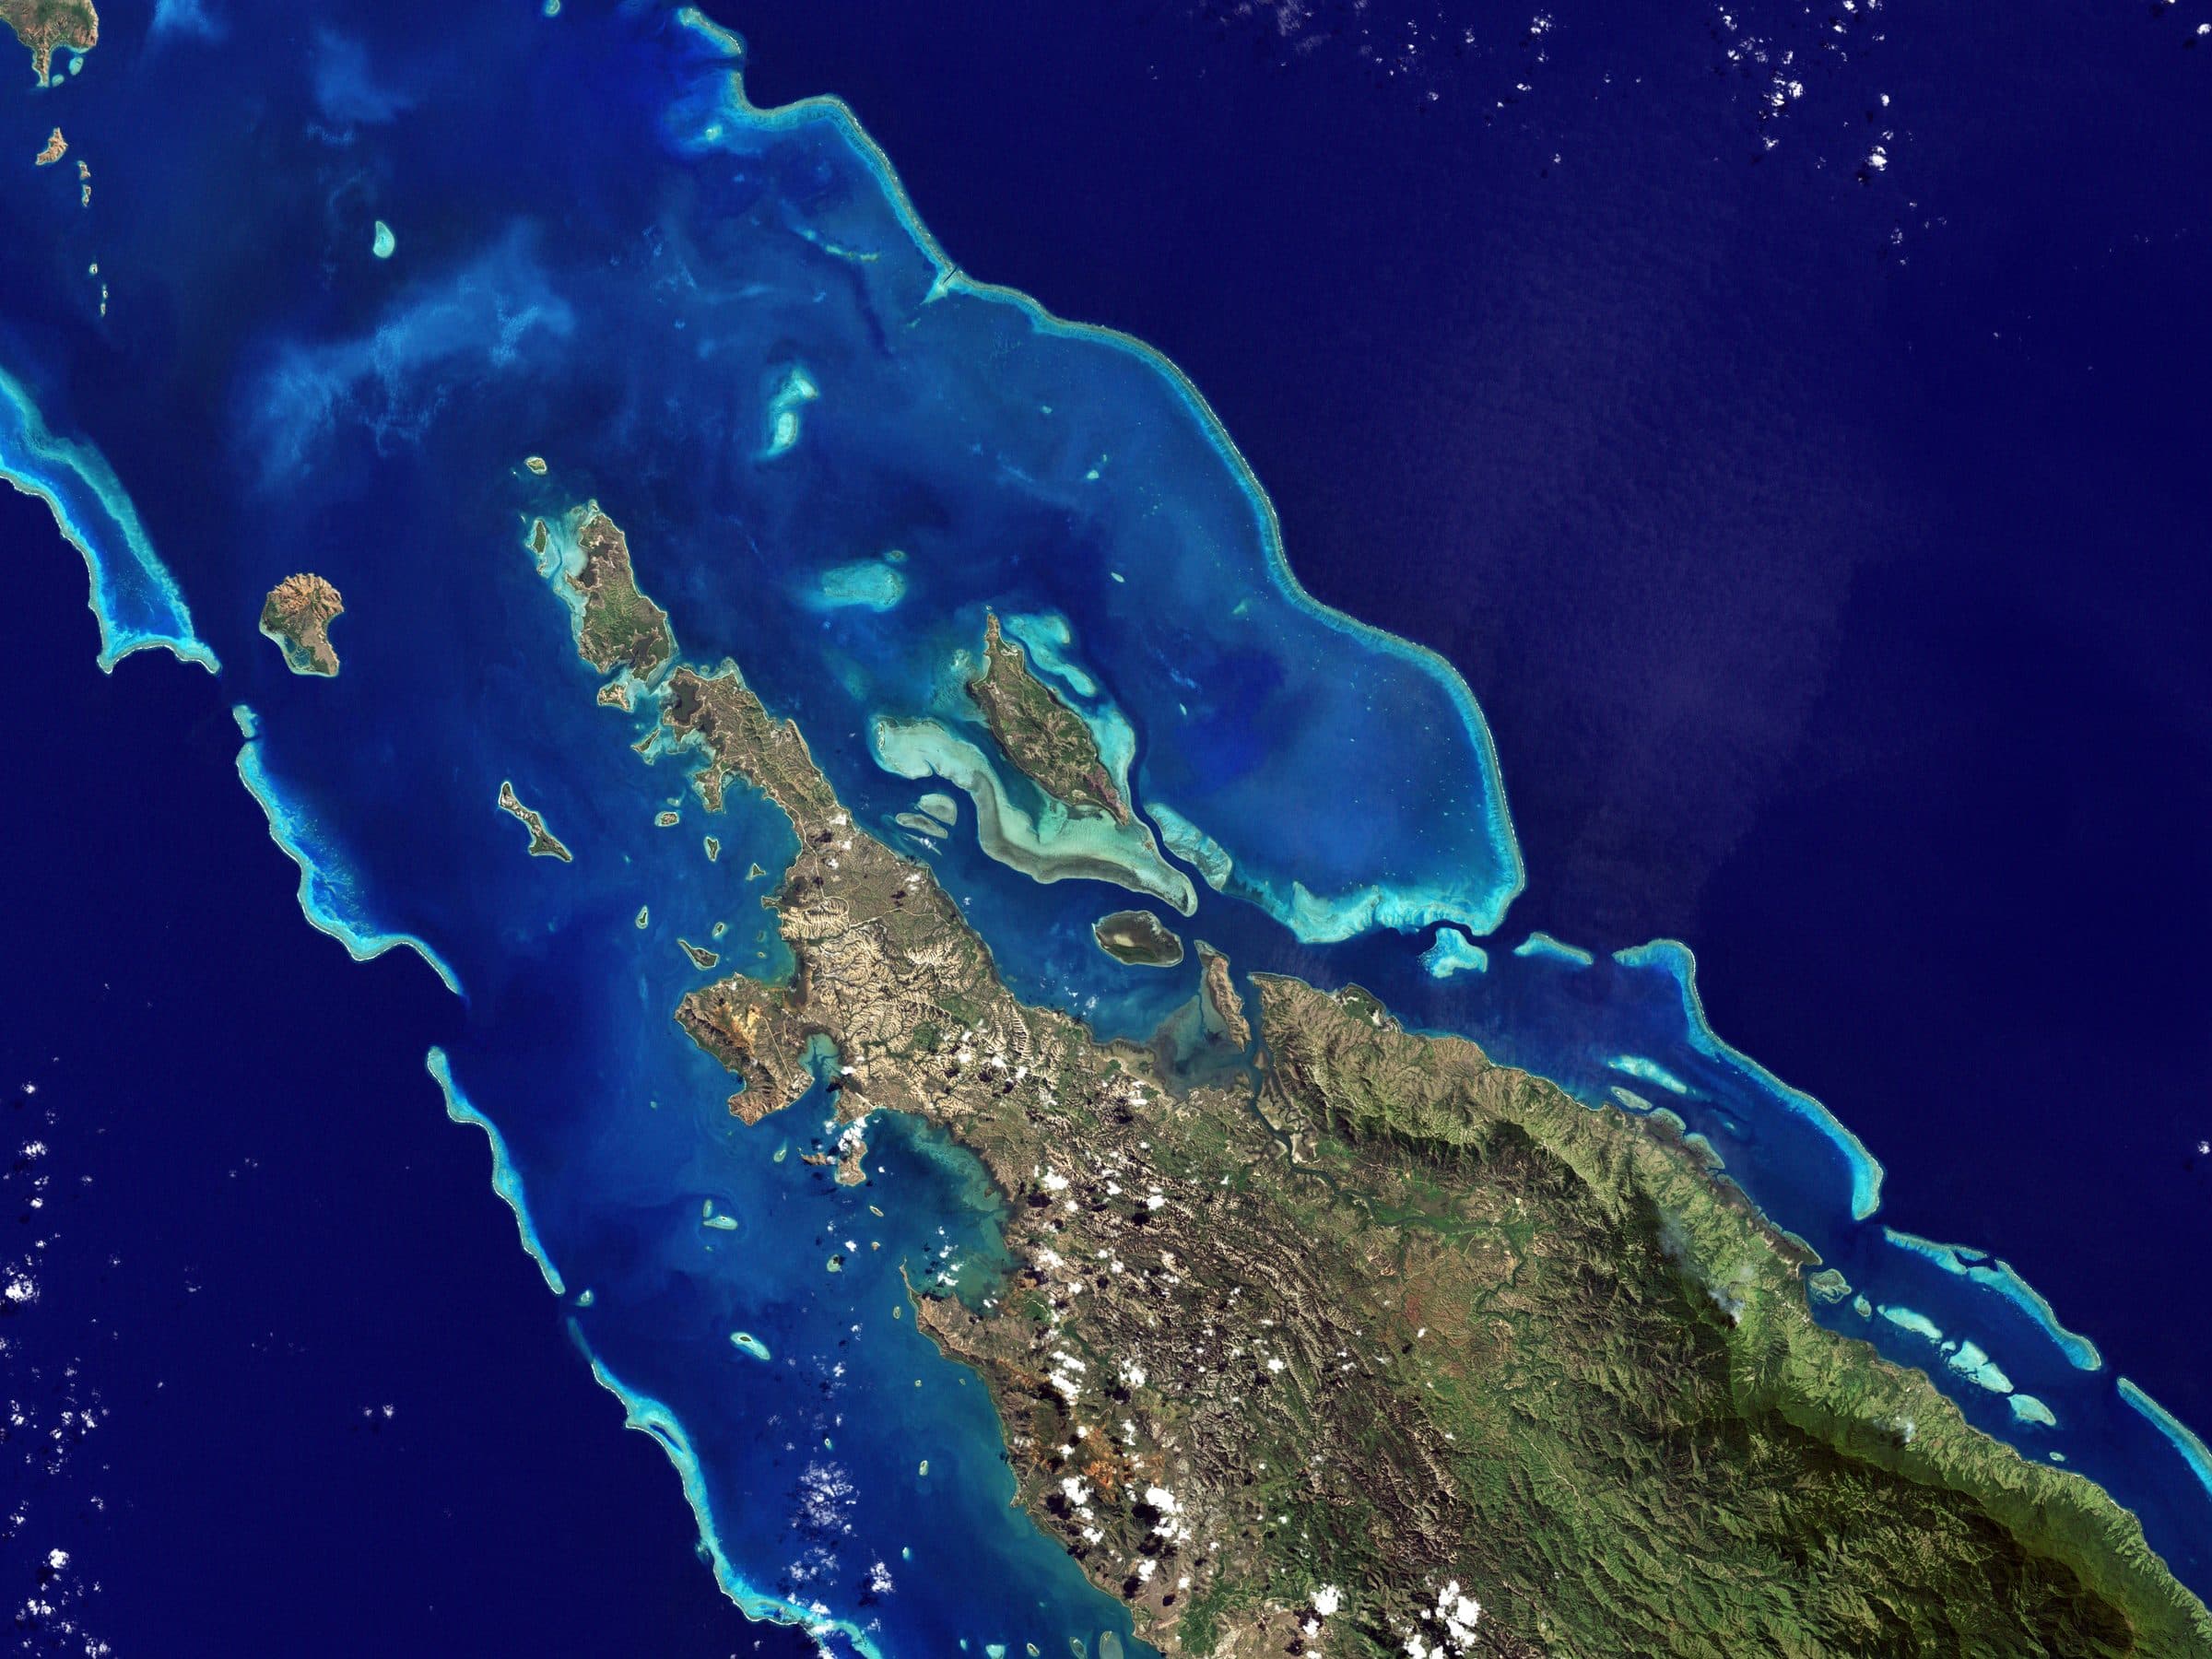
Satellite view of lagoons and reefs

03 · Pollution on the water, tracked as it moves

Marine

Radar detects oil on the sea surface through cloud and at night. The platform finds the slick, maps its extent and follows it across successive passes as it drifts, spreads and disperses.

  • Oil spill detection

    Automatic detection and delineation of surface oil from SAR imagery with look-alike suppression.

    Engagement
  • Drift and evolution tracking

    The same slick followed across passes: direction, drift rate, area change and dispersion.

    Engagement
  • Marine pollution monitoring

    Discharge plumes, sediment, turbidity and algal bloom extent from optical imagery.

    Engagement
  • Coastal impact assessment

    Affected coastal stretch and sensitive receptors in the drift path.

    Engagement
  • Standing watch

    Continuous automated monitoring of a maritime area with alerting on detection.

    In development
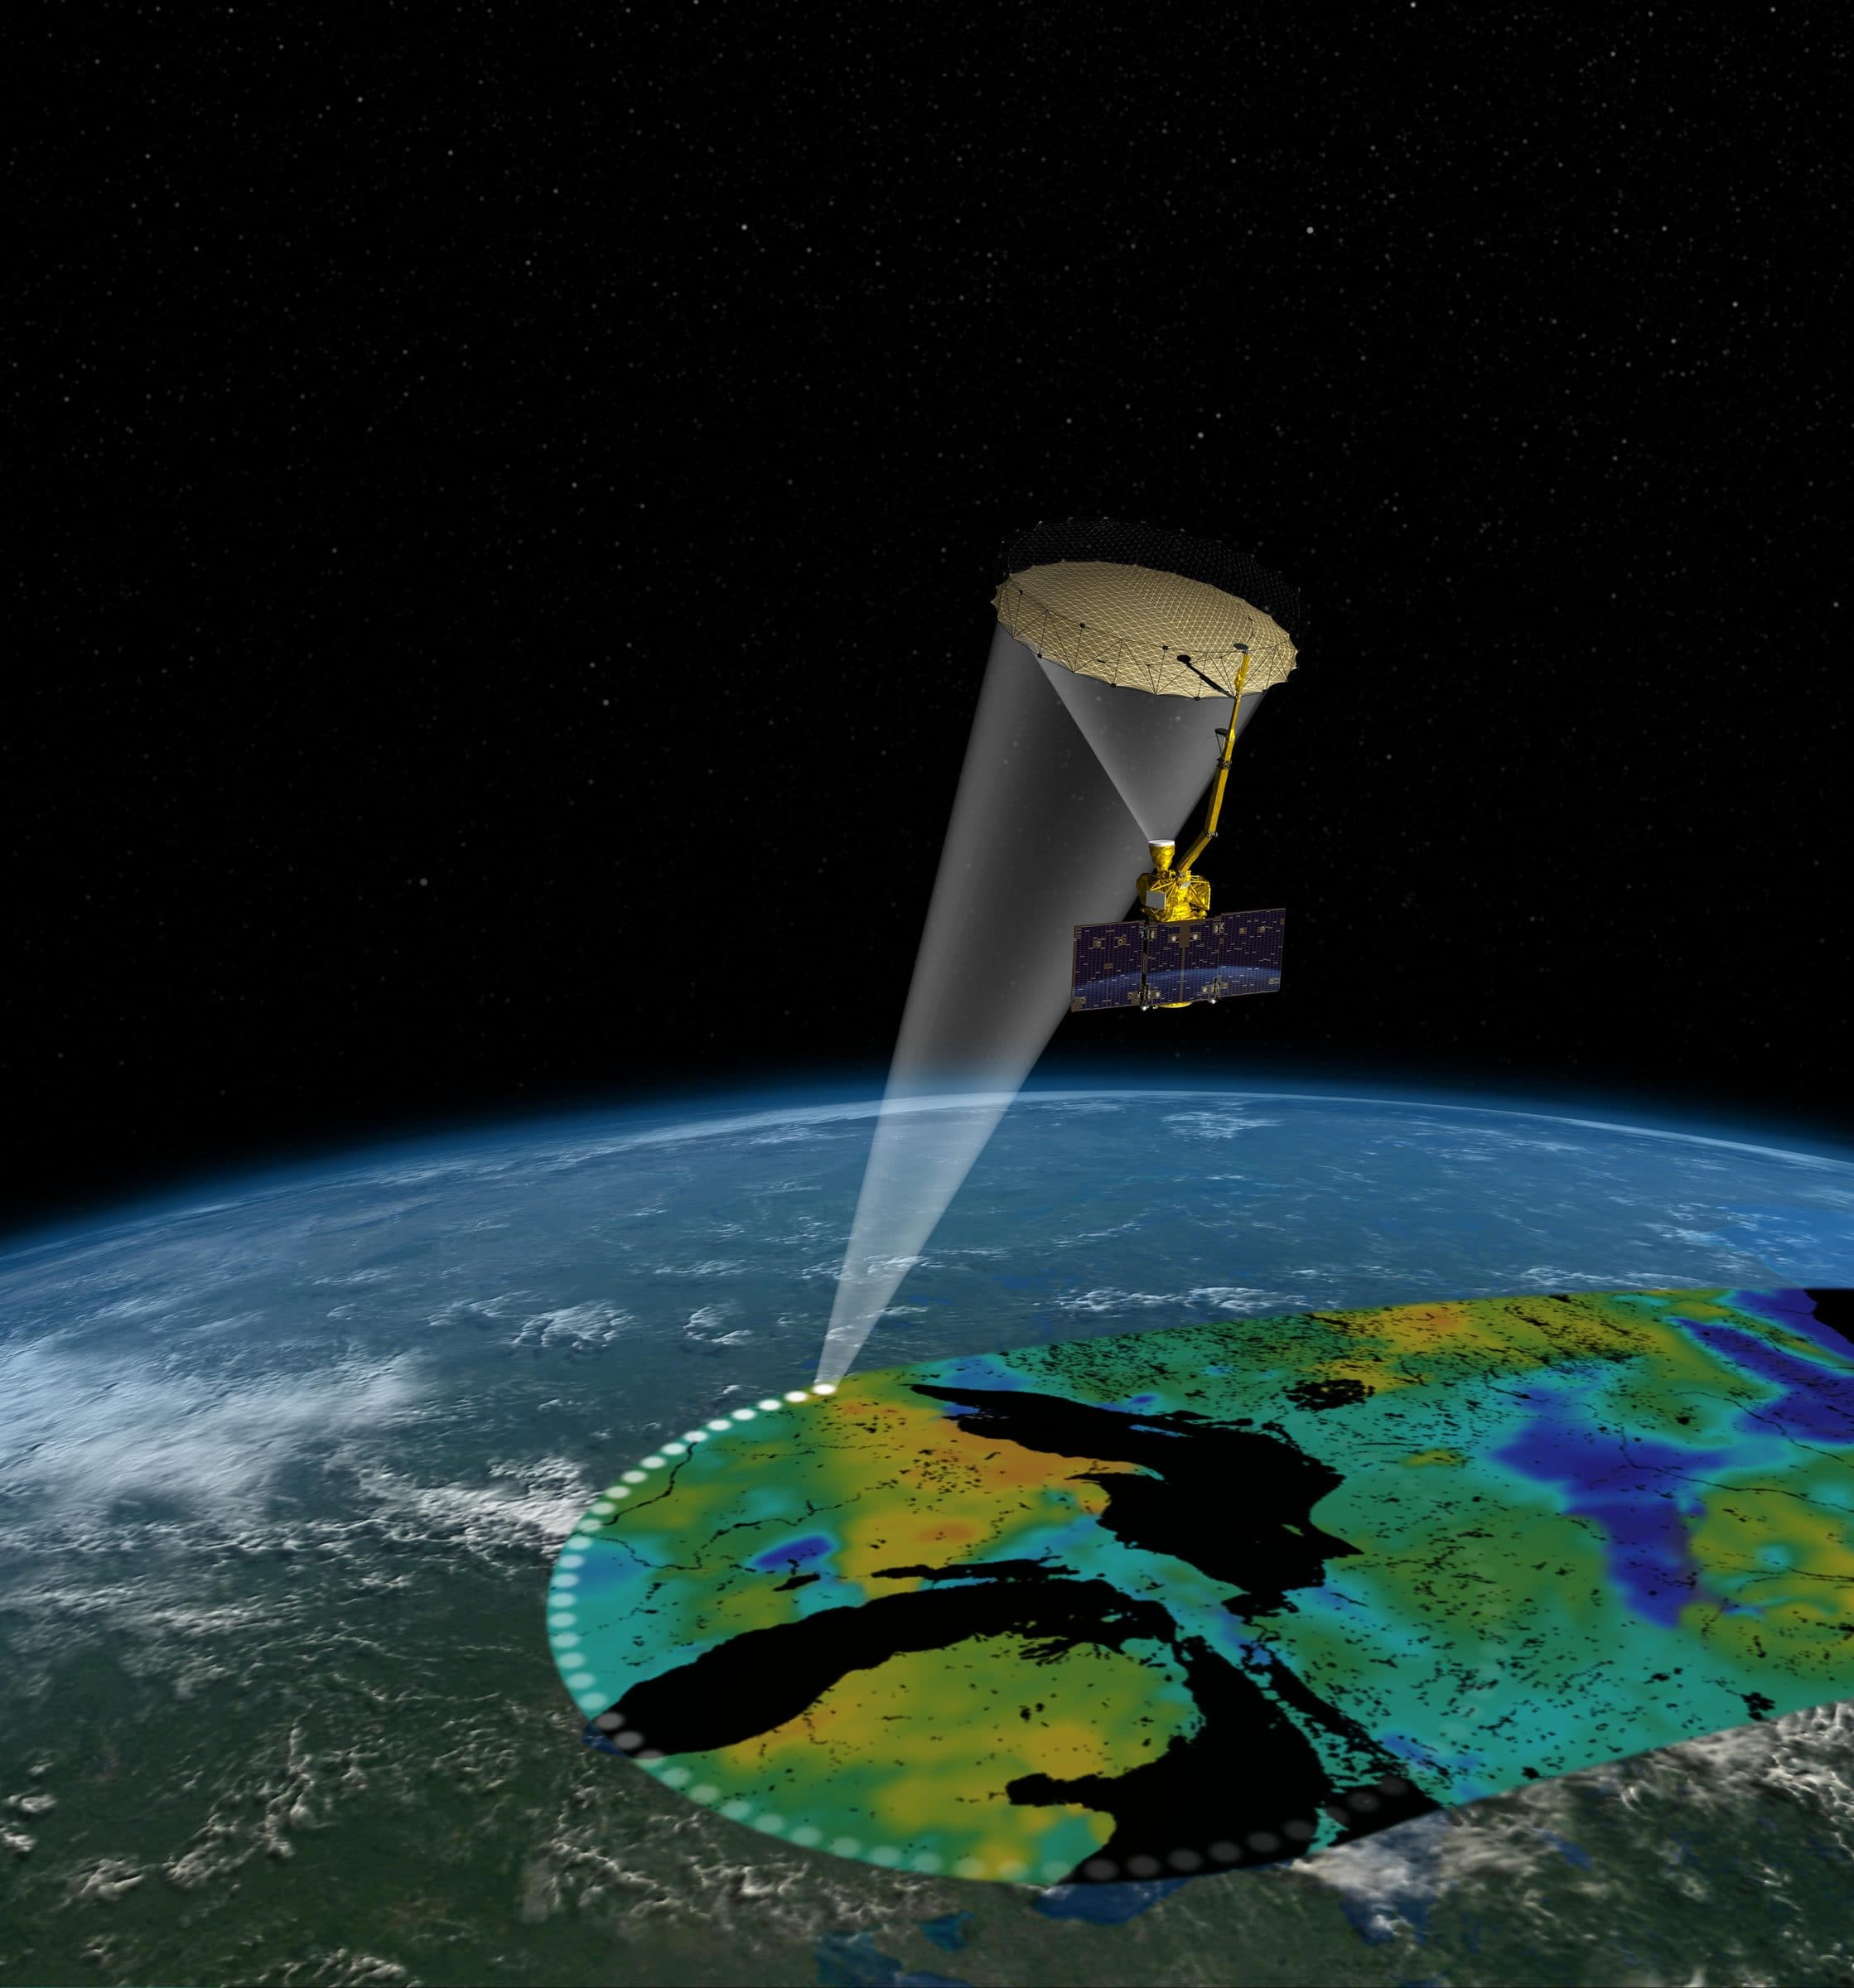
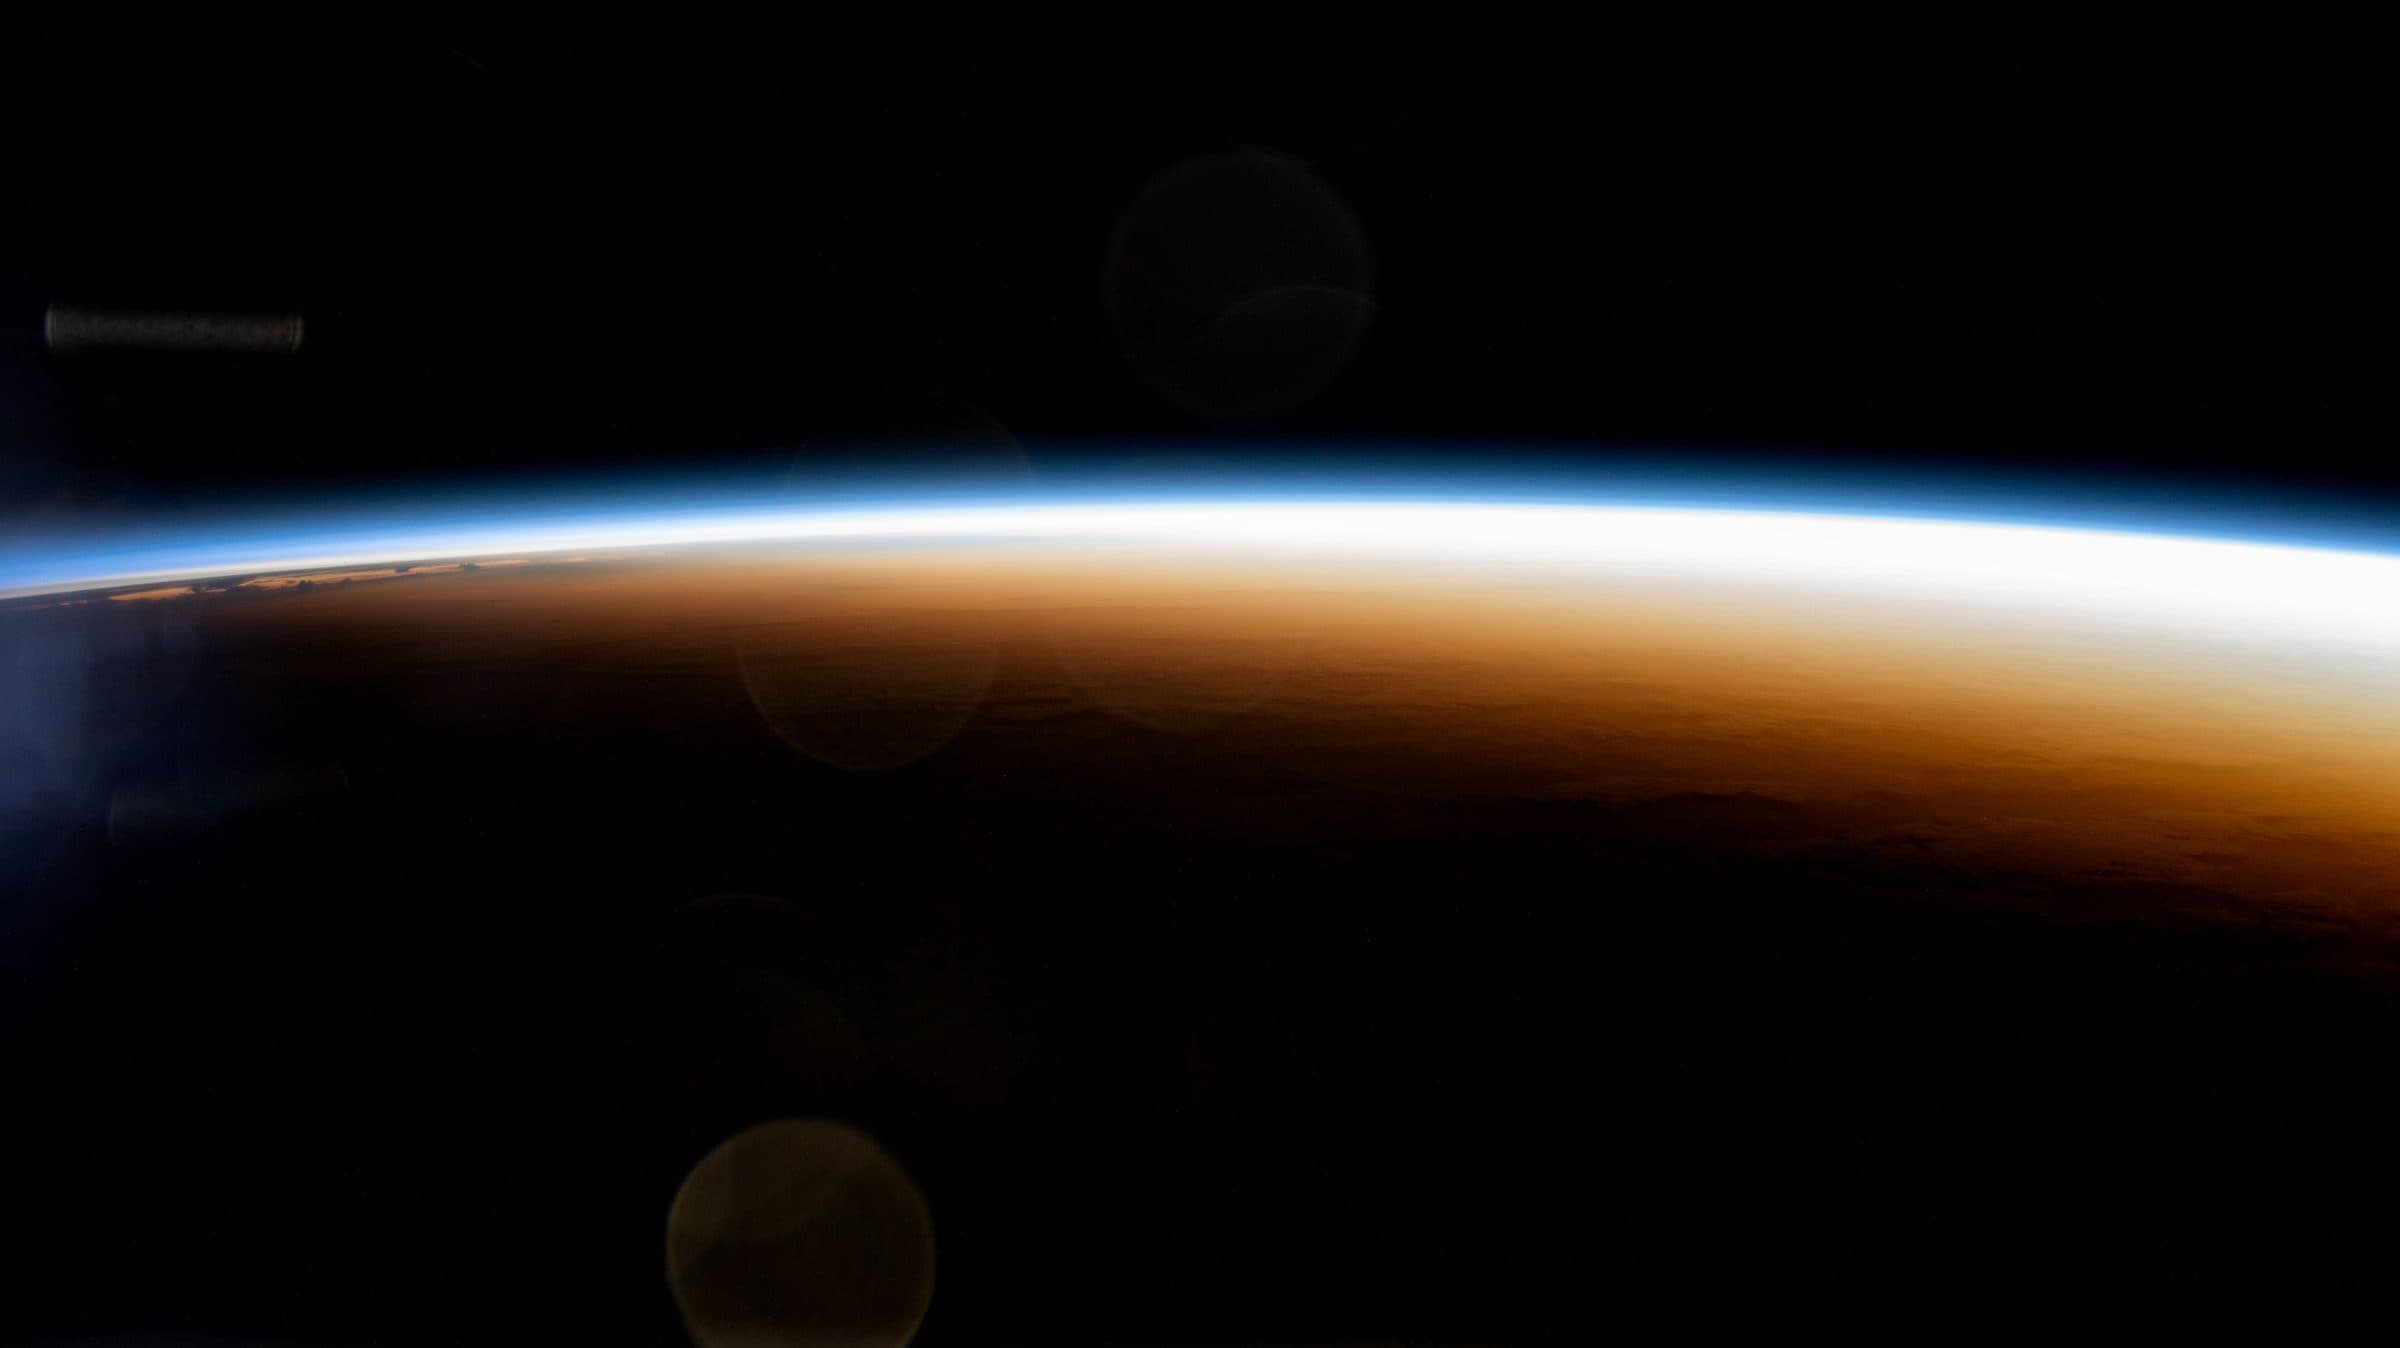
Earth observation satellite in orbit

04 · Exploration targets before the ground campaign

Mining and geology

Spectral and structural analysis over multispectral and hyperspectral imagery to map alteration mineralogy and lineaments, rank exploration targets and monitor ground stability around operating mines.

  • Hyperspectral mineral mapping

    Alteration mineralogy and material identification from hundreds of contiguous spectral bands.

    Engagement
  • Exploration target ranking

    Spectral, structural and geological evidence combined into a ranked list of targets for drilling.

    Engagement
  • Mine subsidence and stability

    InSAR deformation monitoring of pits, tailings and infrastructure.

    Engagement
  • Environmental compliance

    Land disturbance, water and vegetation change around operations, tracked over time.

    Engagement
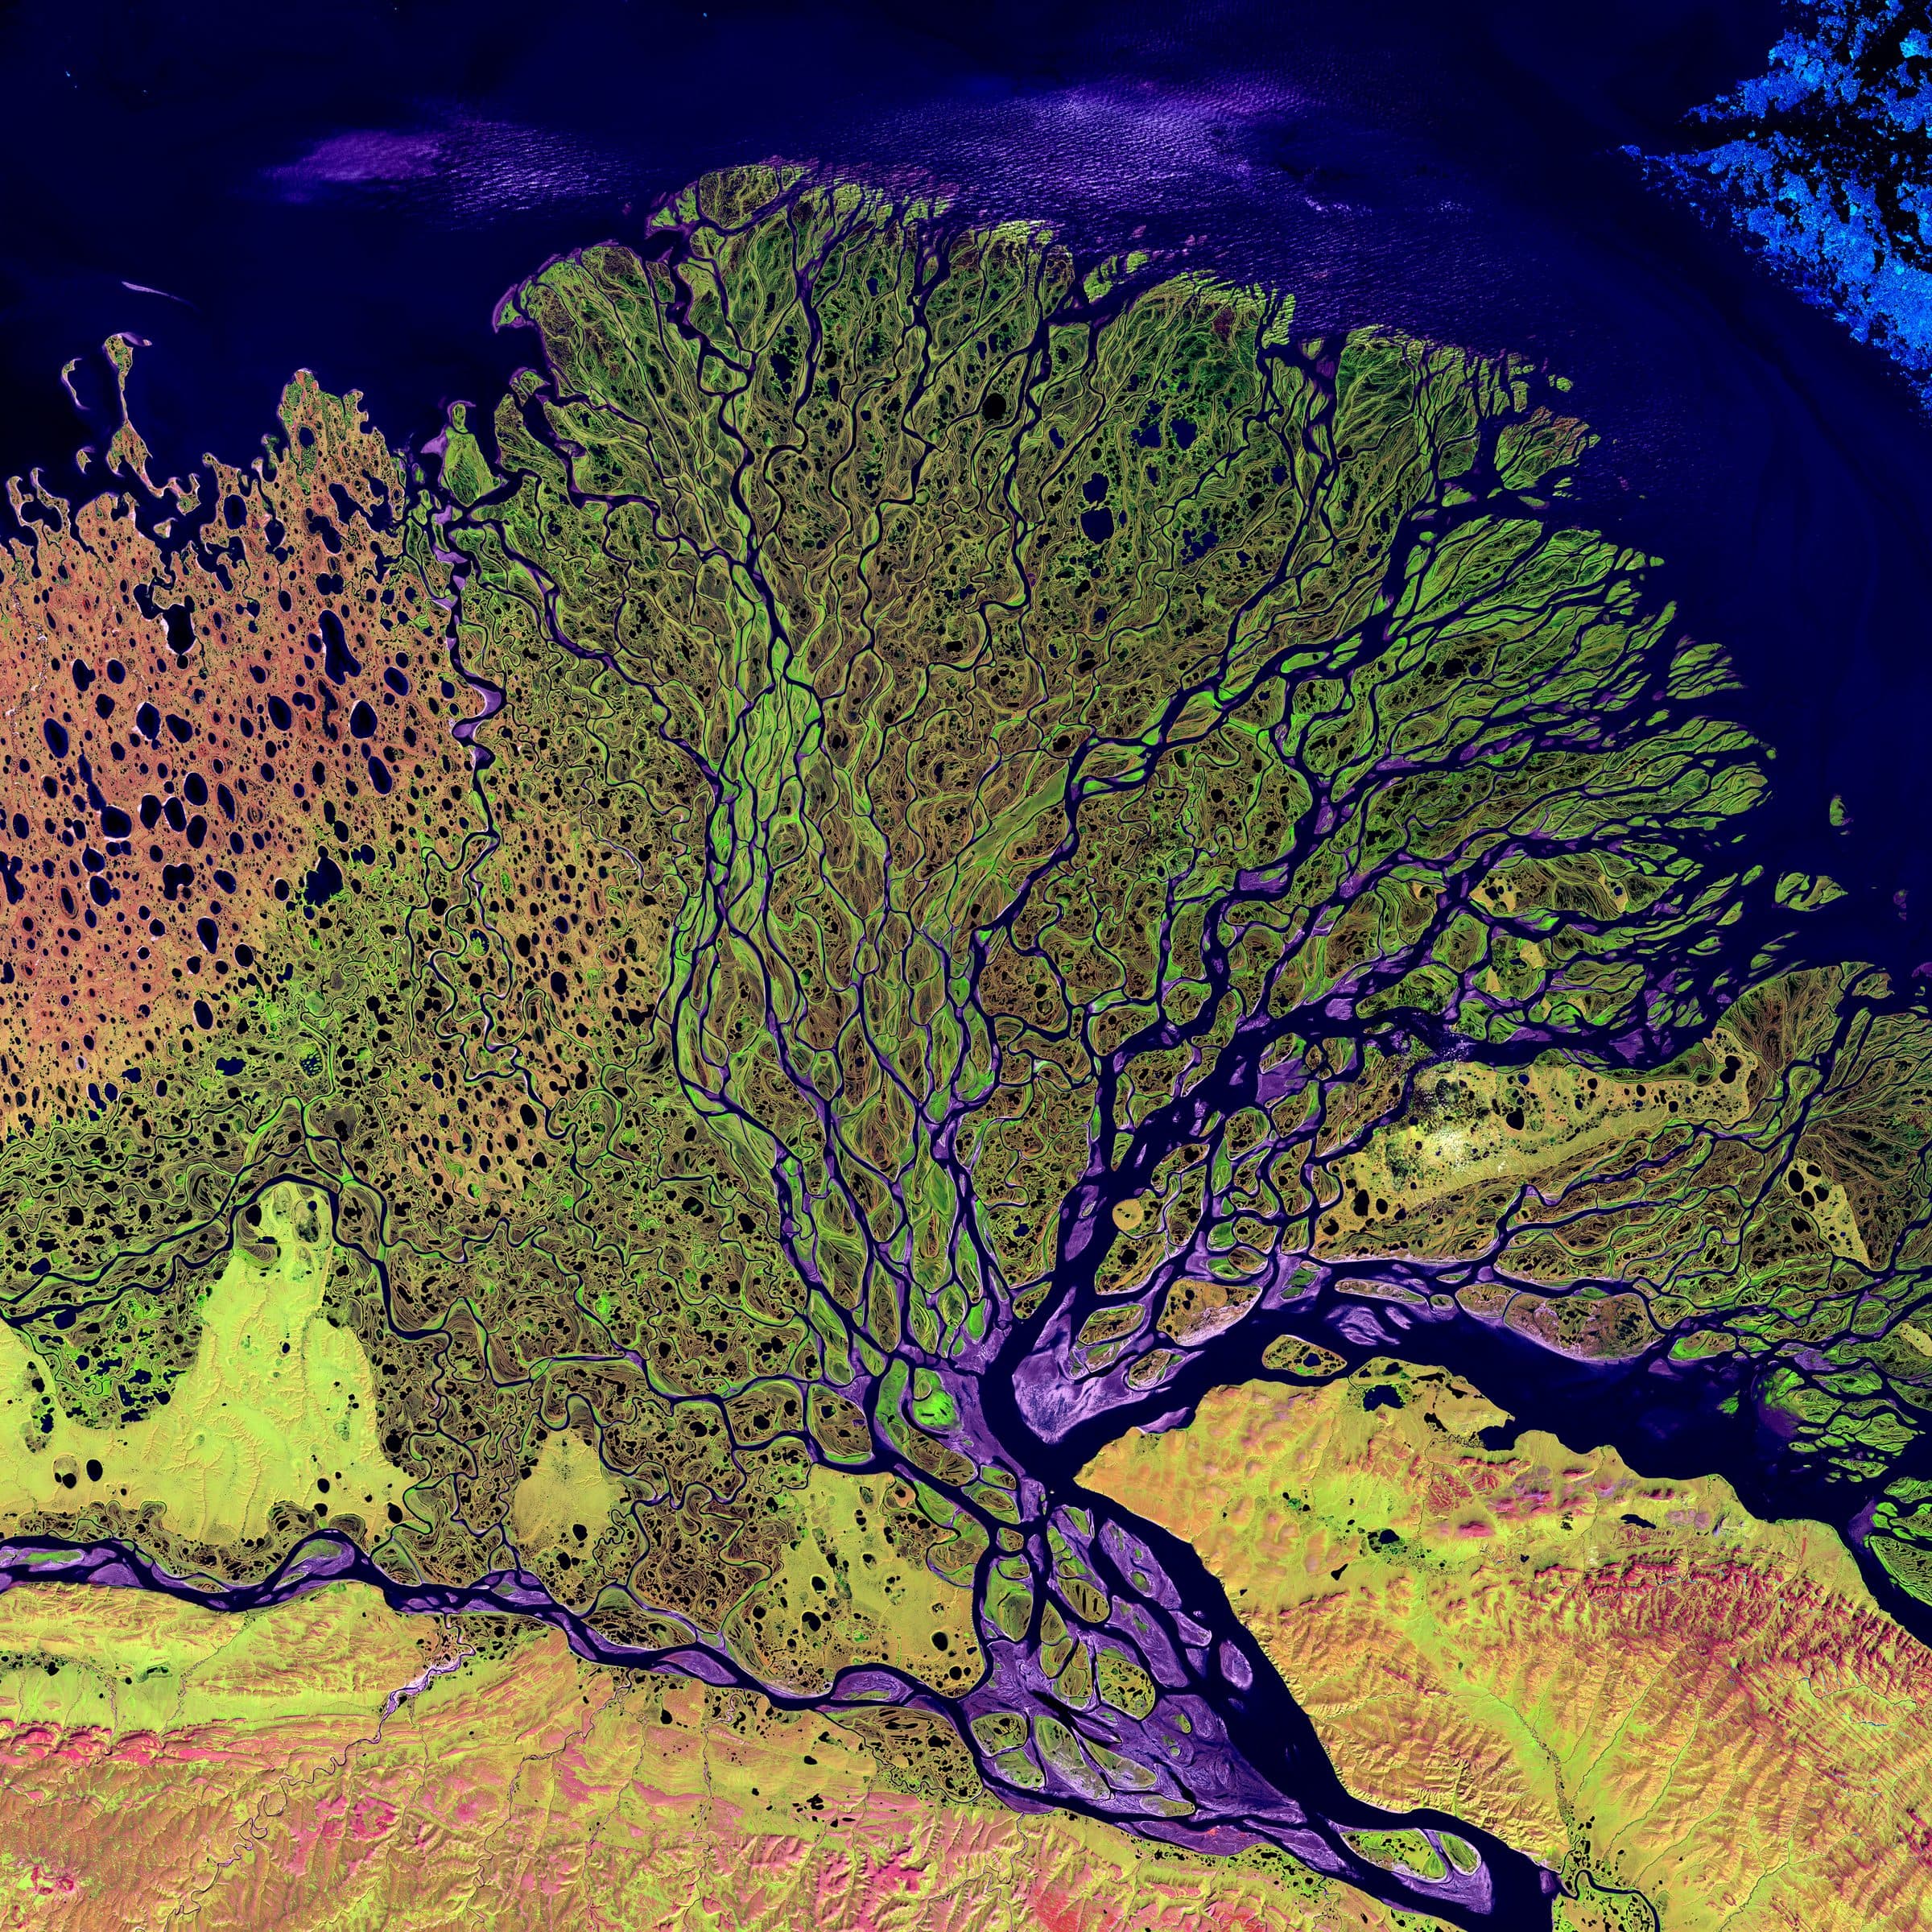
Satellite view of a river delta

05 · Where the water is, how much, and where it is going

Water

A complete operating picture for lakes, reservoirs, wetlands and rivers: open water measured on every pass, the record reconstructed to 1984, and a six-month outlook.

  • Surface water and wetland monitoring

    Open-water extent, permanence, context layers, forty-year history and six-month forecast, self-service.

    Hub platform
  • Water quality indicators

    Chlorophyll-a proxy for algal bloom, turbidity and bare-soil exposure.

    Hub platform
  • Evaporation and water budget

    Satellite evapotranspiration against precipitation for basins and irrigation schemes.

    Processing service
  • Soil moisture

    Radar wet-surface detection and satellite soil moisture at catchment scale.

    Hub platform
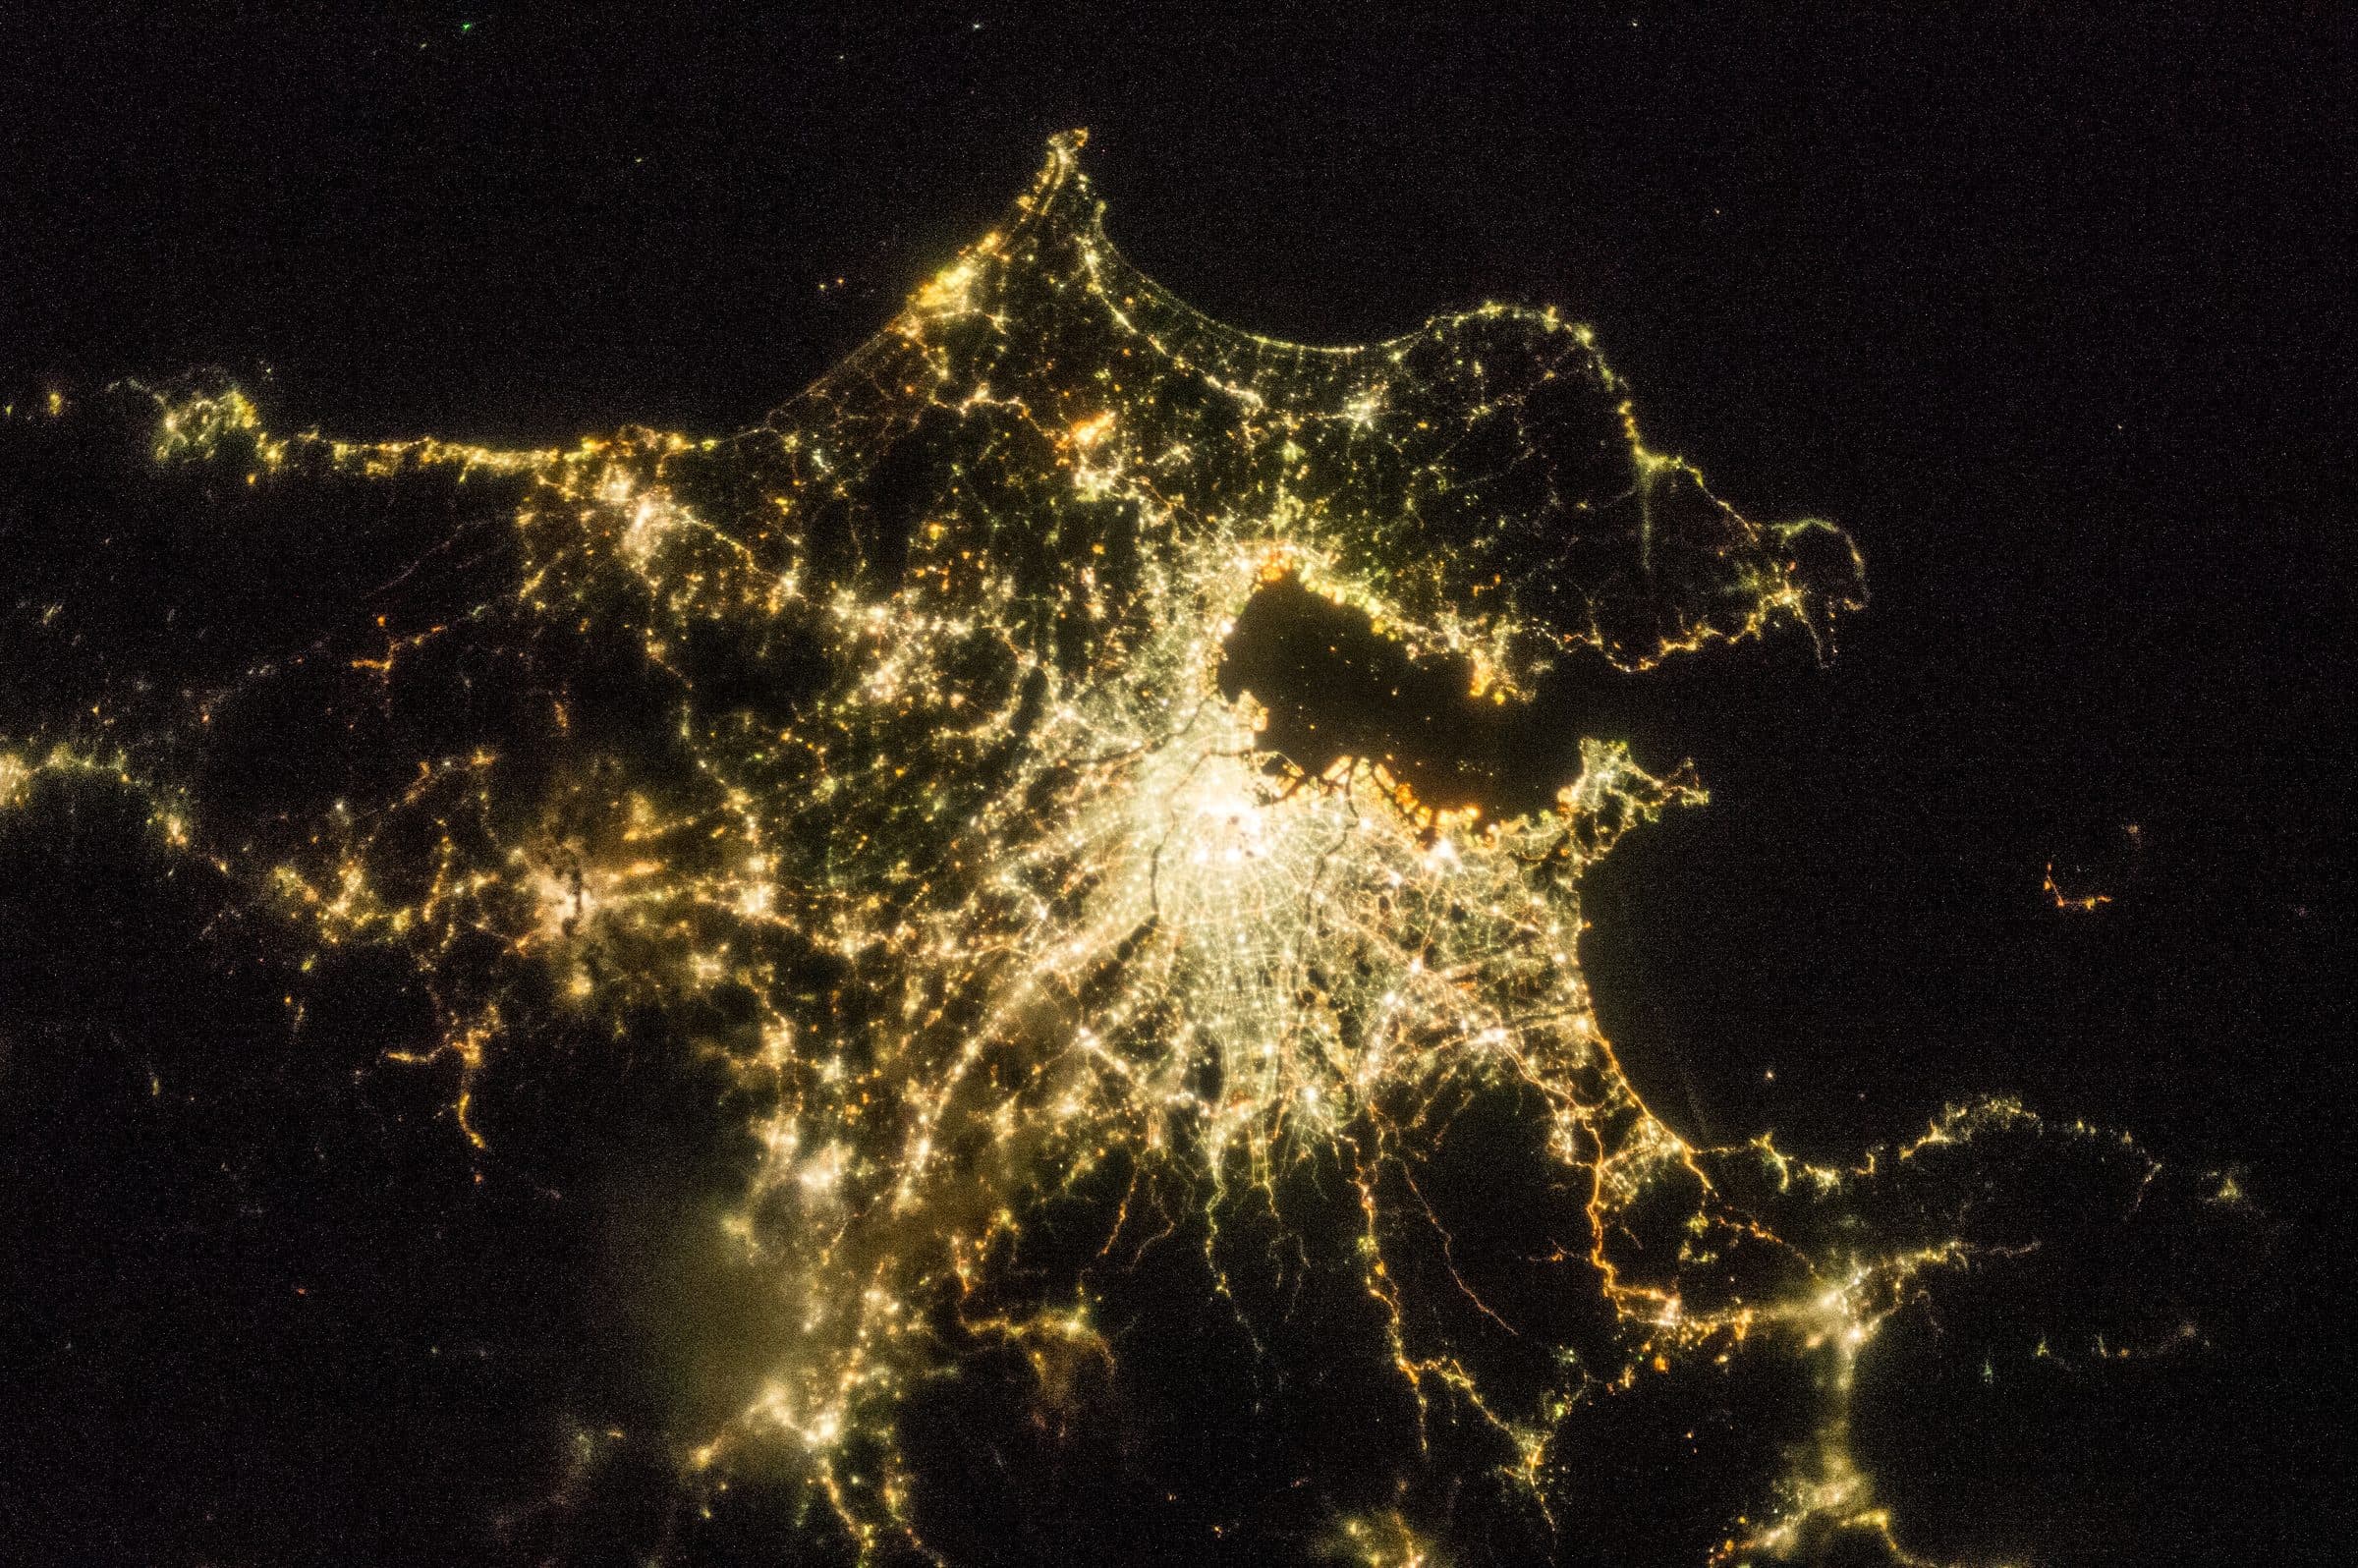
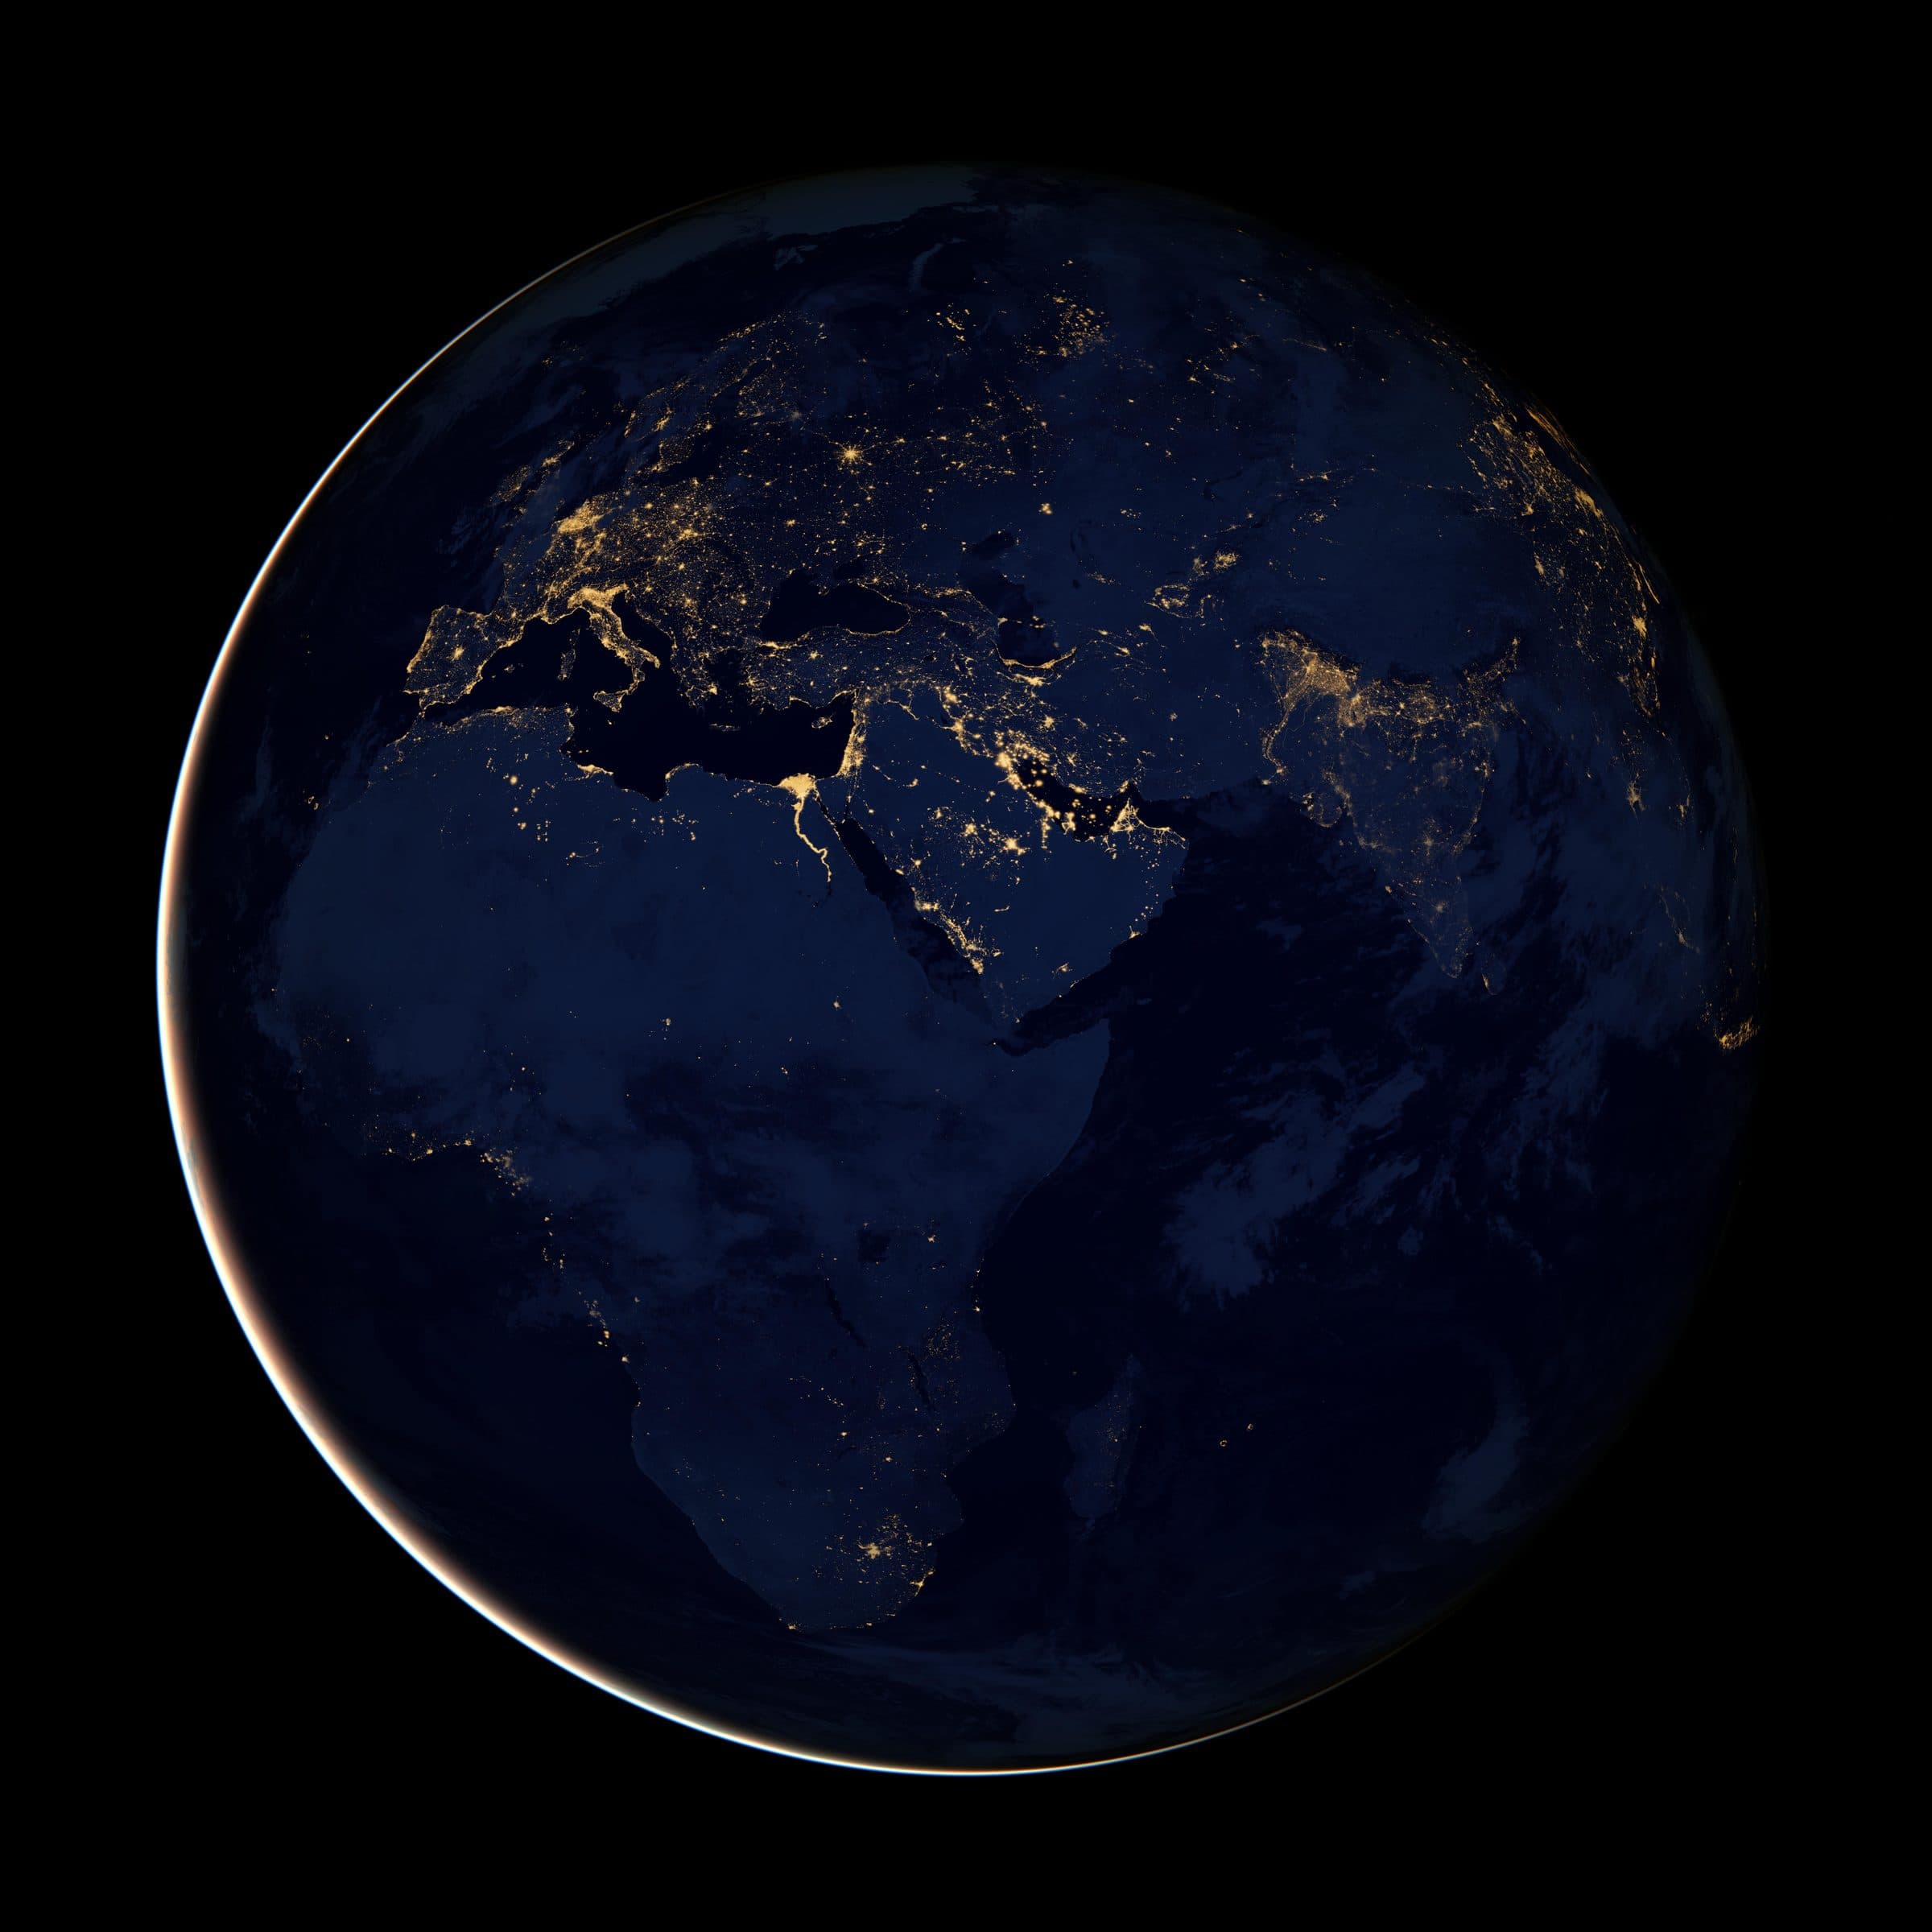
City lights photographed from orbit

06 · Detail beyond the sensor

Vision

Fine detail reconstructed from standard imagery with super-resolution models, change detection at the recovered scale, and material identification from hyperspectral data.

  • Satellite super-resolution

    Spatial enhancement of visible and near-infrared imagery, consistent across a time series.

    Processing service
  • Sub-metre change detection

    Buildings, roads, earthworks and encroachments detected on enhanced imagery.

    Processing service
  • Hyperspectral analysis

    Materials identified by spectral signature: minerals, water constituents, vegetation species, contamination.

    Engagement
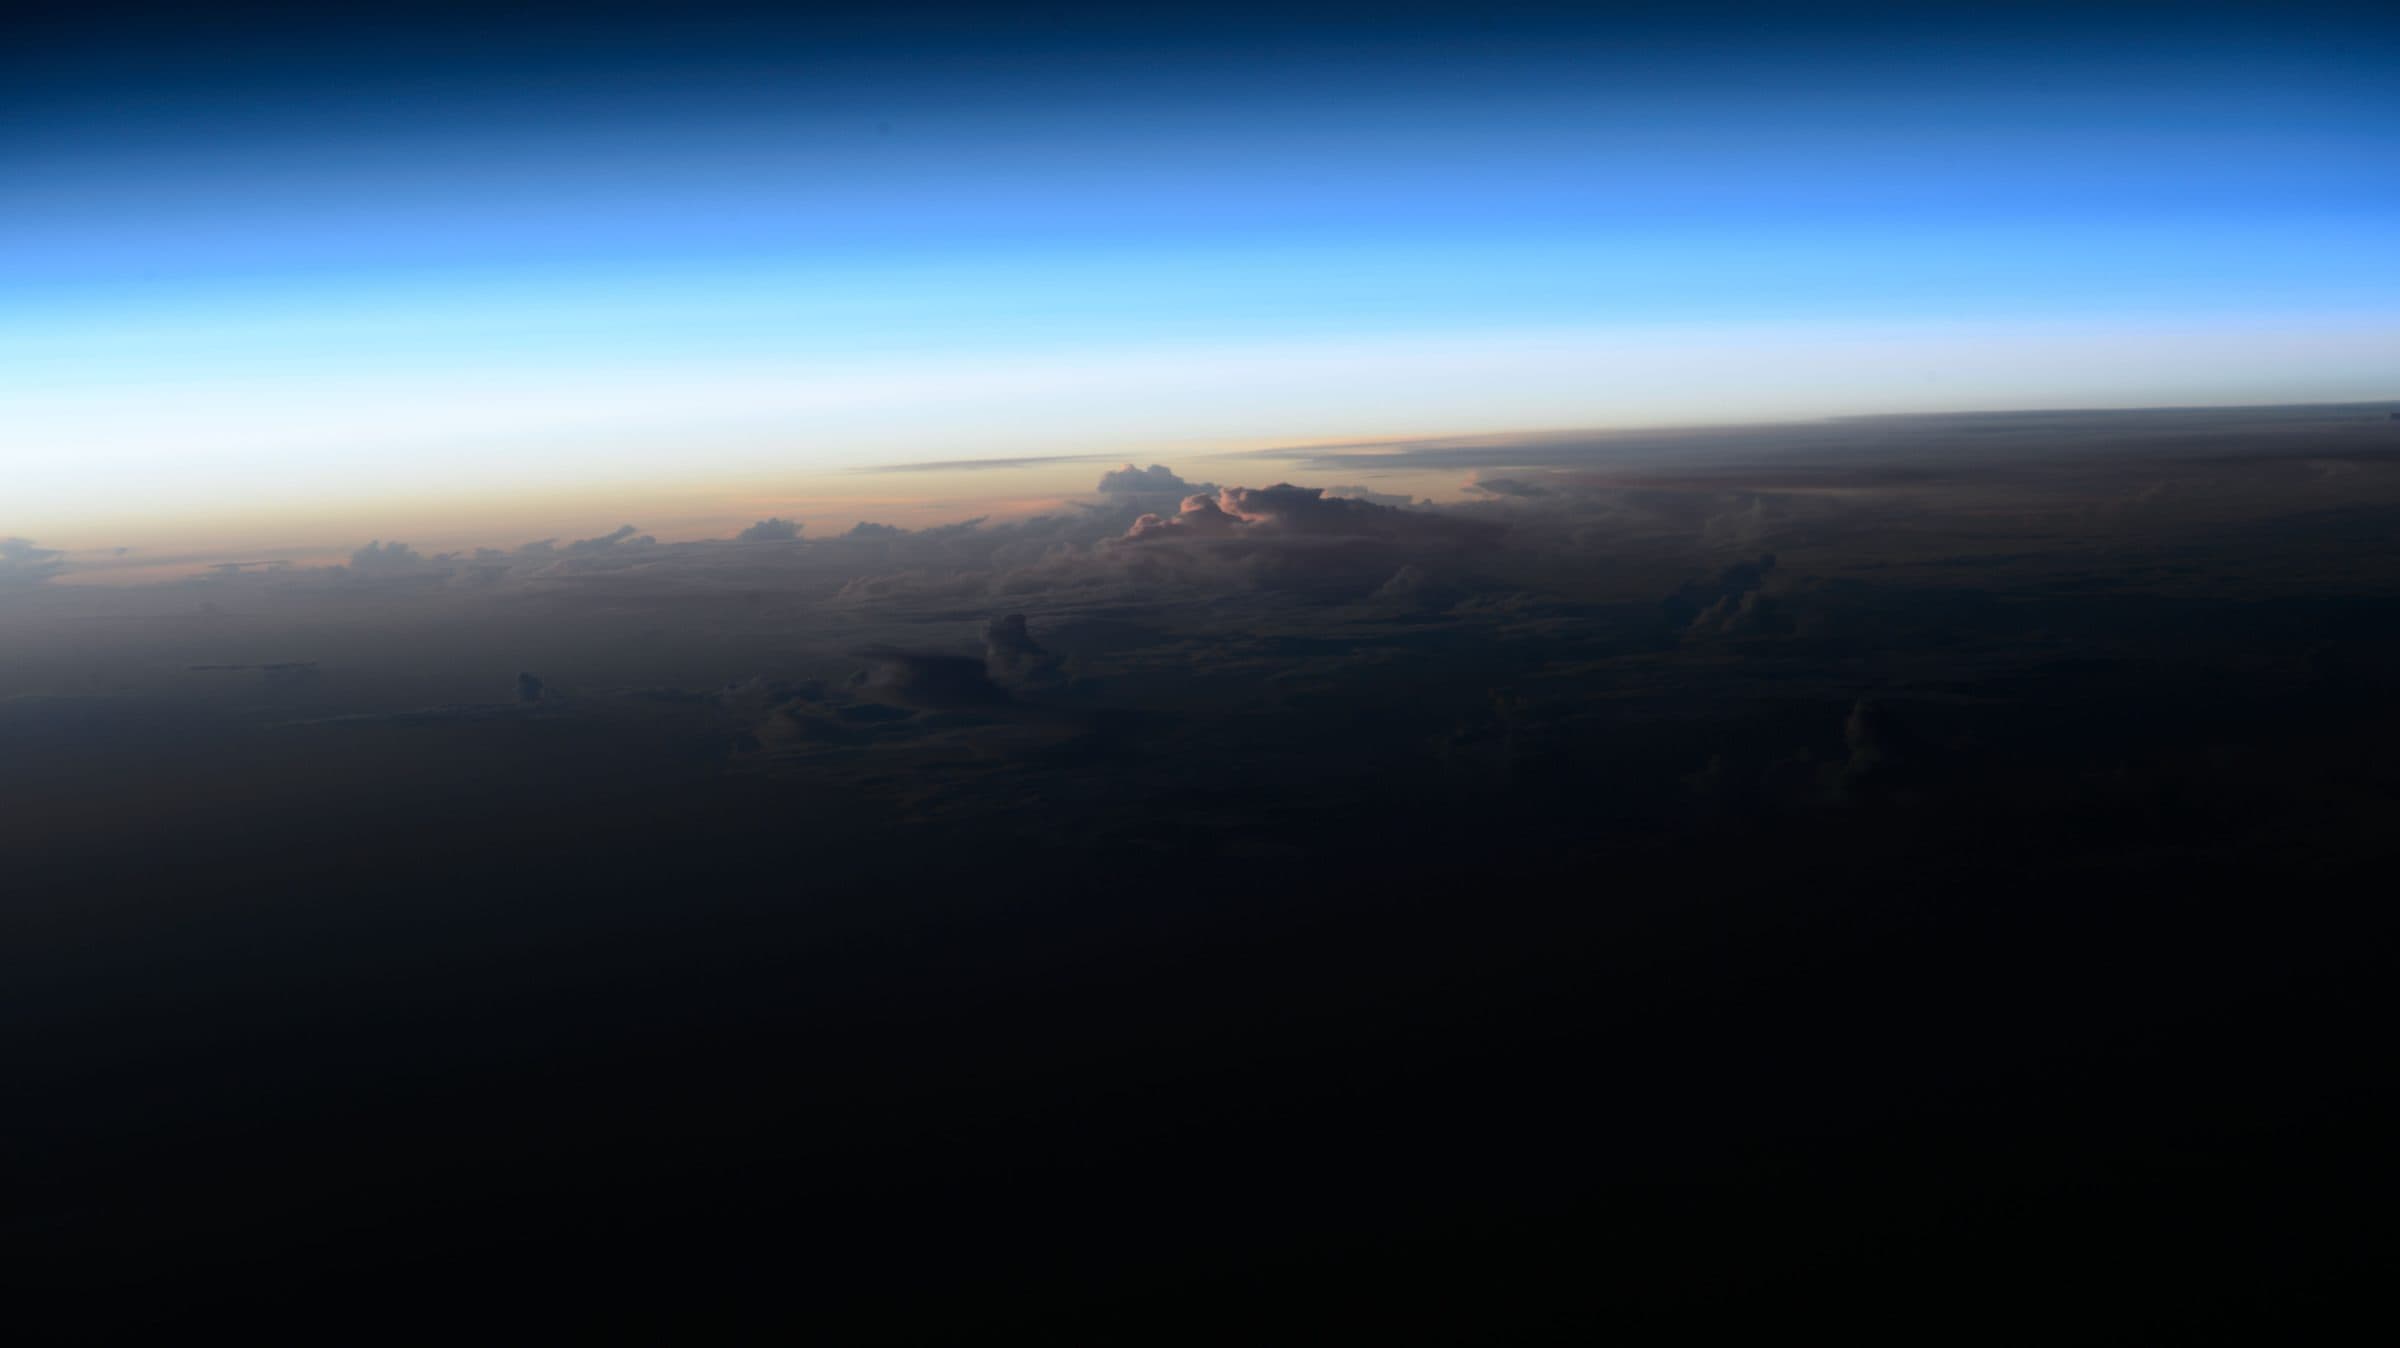
Earth's atmosphere seen from orbit

07 · The state of the atmosphere, days ahead

Weather and climate

Global AI weather models run as one ensemble, weighted by demonstrated skill and corrected to the station scale, delivered with the disagreement made visible.

  • AI precipitation and temperature forecasting

    Ten-day ensemble forecasts with station-level correction and uncertainty.

    Hub platform
  • Water-area forecast

    Six-month outlook for monitored lakes, wetlands and reservoirs.

    Hub platform
  • Drought, flood and fire-weather outlooks

    Forecast fields combined with observed surface state into forward-looking risk.

    In development
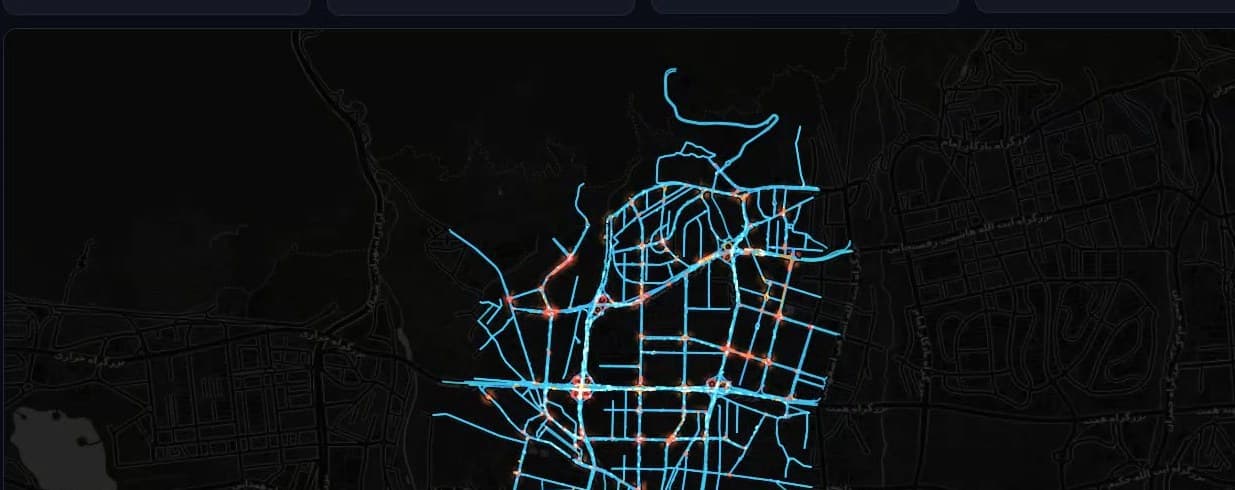
Simulated traffic speed on a city road network

08 · Decisions on your own data

Urban and spatial decision support

Digital twins and WebGIS platforms that put a city's mobility or an organisation's network on one map, with simulation, analysis and a decision workflow.

Platform

What every product inherits

All products run on the same data foundation and account, so a capability built for one is available to all.

  • Your own area of interest

    Any polygon, anywhere. Upload existing boundaries or draw new ones; saved areas are reusable across every product.

  • Four decades of history

    Any analysis can be run backwards through the archive, so today's measurement arrives with its own trend line.

  • Cloud-free by design

    Radar sees through cloud and darkness; optical results are cloud-masked and composited. Coverage does not stop in the wet season.

  • Time series, not snapshots

    Every measurement is stored against its date, charted automatically and available as a downloadable series.

  • Compute once, reuse everywhere

    Results are cached and spatially reused: an area already processed inside a larger run is clipped, not recomputed, and seasonal products re-run automatically when their input window closes.

  • Open outputs

    Cloud-optimised GeoTIFF with provenance tags, shapefile, GeoJSON, CSV, PDF reports and map images. Results move into any GIS or BI tool you already run.

  • API access

    Every analysis available in the interface is available as an authenticated REST call for integration into your own systems.

  • Teams and governance

    Organisation accounts with sub-users, role-based access, shared processing quotas and an audit of every analysis run.

Introduction plan

From first conversation to running product

Every product is introduced the same way, so the accuracy you see is measured on your own ground before you commit.

  1. 01

    Scoping

    What you need to measure, over what area, at what frequency, and what decision it feeds.

  2. 02

    Pilot

    A defined area and period processed and delivered as the real output, so accuracy is assessed on your own ground rather than on examples.

  3. 03

    Deployment

    Subscription, per-area service or bespoke build, in the cloud, in your cloud or on-premises, with training and handover.

Sequence of introduction. Hub platforms come first because they can be explored immediately. Processing services follow as a pilot on your area. Engagements are scoped after the pilot has shown what the data supports.

From space. For Earth.

Start with a pilot on your own area

Tell us the question, the area and the decision it feeds. We process a defined area and period and deliver the real output.