
Products · Agriculture
Crop Type Classification
Field-level crop identification from the seasonal signature, while the crop is still standing.
Processing service delivered per area of interest
Overview
What is planted in each field this season, and how much area does each crop cover?
Every crop has a phenological signature: a characteristic curve of greenness, water content and canopy structure through the season. The product reads that curve from a stack of optical and radar observations and matches it against the crop calendar of the zone, so a classification is made in-season rather than after harvest. Because the method is calibrated per zone rather than hard-coded, it transfers across regions, climates and hemispheres.
- The field, per season
- Unit
- In-season, before harvest
- Timing
- Optical and radar time series
- Inputs
- Map, statistics, report
- Delivery
Example outputs
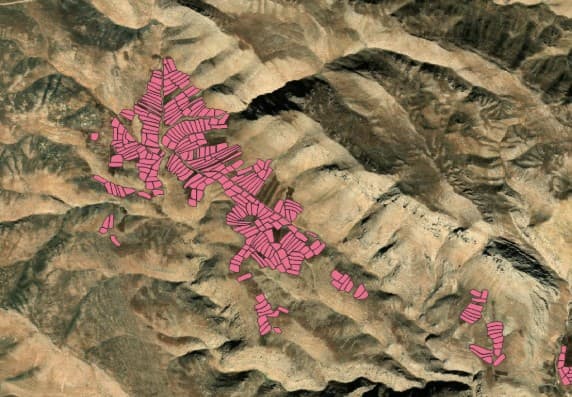
Field-level units over mountainous terrain with small, irregular fields.
How it works
Pipeline and maturity of each stage
- 01
Time-series stack
OperationalCloud-masked optical observations and radar backscatter are assembled for the whole season over the area of interest and aligned to field boundaries.
- 02
Phenological features
OperationalSpectral indices and radar profiles are turned into per-field seasonal curves, which are robust to individual cloudy or noisy dates.
- 03
Classification
OperationalTime-series models trained on locally labelled fields, anchored to the zone's crop calendar, assign a crop class and a confidence to each field.
- 04
Aggregation and delivery
OperationalField results are aggregated to district and regional cultivated-area statistics and delivered as a crop map, tables and a report.
Data used
- Sentinel-2
- Sentinel-1 SAR
- Landsat 8/9
- Field boundaries
- Local crop calendar and field labels
Methods and models
- Time-series deep learning
- Phenology-anchored classification
- SAR and optical fusion
- Per-zone calibration
Outputs
- Crop map (GeoTIFF)
- Per-field class and confidence (vector)
- Cultivated-area statistics by crop and unit (CSV)
- PDF report
Who it is for
- Agriculture ministries and statistics offices
- Crop insurance and subsidy verification
- Water allocation and irrigation planning
- Commodity and supply-chain analysis
More in Agriculture
All agriculture products- Field boundary extraction
- Rainfed / irrigated classification
- Agricultural water accounting
- Cultivated-area mappingProcessing service
- Crop condition and stressProcessing service
- Irrigation water demandIn development

From space. For Earth.
Start with ARASAT
Tell us what you need to monitor, understand or protect. Our team works with you from the first conversation to a running program.